1

enter image description here

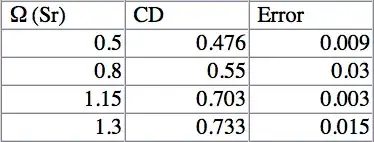
Mathematica ListPlot function allows me to plot the above data with omega on the x-axis and CD on the y-axis

enter image description here

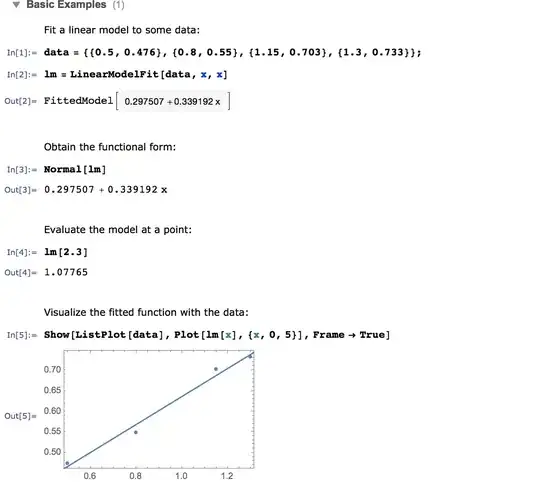
1) How do I incorporate the error bars in my data on the graph? 2) Are there any basis statistical analysis I could possibly extract from my exists data table?

boyinneed
  • 37
  • 1
  • 1
  • 3

1 Answers1

8
MyData = {{0.5, 0.476}, {0.8, 0.55}, {1.15, 0.703}, {1.3, 0.733}};
error = {0.009, 0.03, 0.003, 0.015};
withError = Transpose[{MyData[[All, 1]], MyData[[All, 2]], error}]

{{0.5, 0.476, 0.009}, {0.8, 0.55, 0.03}, {1.15, 0.703, 0.003}, {1.3, 0.733, 0.015}}

Needs["ErrorBarPlots`"]
Show[ListPlot[MyData], Plot[lm[x], {x, 0, 5}],ErrorListPlot[withError,
PlotStyle -> Red]]

enter image description here

See also: ErrorListPlot