I'd like to plot two histograms on top of one another, but they have very different scales. Is it possible to plot a histogram with two y-axes, similar to the custom function found here for plots?
Asked
Active
Viewed 768 times
2
1 Answers
6
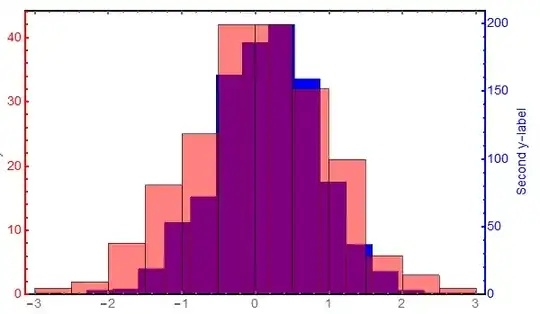
More or less a duplicate of this answer, but just to demonstrate how it is used:
Some data:
d1 = RandomVariate[NormalDistribution[0, 1], 200];
d2 =  RandomVariate[NormalDistribution[0, 1], 1000];
Create the individual plots and then combine them using Overlay
optsall = {Axes -> False, Frame -> True, ImageSize -> 600,
   BaseStyle -> {Thick, FontSize -> 14}};
opts1 = {ImagePadding -> {{Scaled[0.05], Scaled[0.11]}, {Scaled[0.04],
       Scaled[0.02]}},
   FrameStyle -> {Thick, {Thick, Red}, Thick, Opacity[0]},
   FrameLabel -> {"x", "First y-label"},
   ChartStyle -> Directive[Opacity[0.5], Red]};
opts2 = {ImagePadding -> {{Scaled[0.05], Scaled[0.11]}, {Scaled[0.04],
       Scaled[0.02]}},
   FrameStyle -> {Opacity[0], Opacity@0, Opacity@0, Blue},
   FrameTicks -> All,
   FrameLabel -> ConstantArray["Second y-label", 4],
   ChartStyle -> Blue};
Histogram[d1, Join[optsall, opts1]];
Histogram[d2, Join[optsall, opts2]];
Overlay[{%, %%}]
bobthechemist
- 19,693
- 4
- 52
- 138
Histogram[{d1, d2}, Automatic, "PDF"]but then you have to handle FrameTicks. – Kuba Mar 29 '15 at 22:37