When I solved the Poisson PDE with function NDSolve in a rectangular domain with hole in the center, and search the first derivative with x and y why appear these protrusions on the diagram around the hole?
And how to draw wectorfield with wectorplot on a rectangle, which have a hole inside? Thanks for help.
G = 13.5 10^6;
θ = 0.002;
n = 5;
m = 5;
Ω =
RegionDifference[Rectangle[{0, 0}, {0.04, 0.04}],
Rectangle[{0.01, 0.01}, {0.03, 0.03}]];
sol = NDSolveValue[{D[u[x, y], x, x] +
  D[u[x, y], y, y] == -2 G θ,
DirichletCondition[u[x, y] == 0.,
 x == 0.01 && 0.01 <= y <= 0.03 ||
  x == 0.03 && 0.01 <= y <= 0.03 ||
  0.01 <= x <= 0.03 && y == 0.01 ||
  0.01 <= x <= 0.03 && y == 0.03],
u[x, 0] == u[x, 0.04] == u[0, y] == u[0.04, y] == 0},
u, {x, y} ∈ Ω,
Method -> {"FiniteElement",
 "MeshOptions" -> {"BoundaryMeshGenerator" -> "Continuation"}}];
Subscript[τ, yz] = -D[sol[x, y], x];
Subscript[τ, xz] = D[sol[x, y], y];
Plot3D[sol[x, y], {x, y} ∈ Ω,
PlotStyle -> None, Mesh -> True, PlotRange -> All,
AxesLabel -> {"x", "y", "ϕ(x,y)"}, PlotTheme -> "Detailed",
LabelStyle -> Directive[FontFamily -> "Courier New"]]
Plot3D[Subscript[τ, yz], {x, y} ∈ Ω,
PlotStyle -> None, PlotTheme -> "Detailed", Mesh -> True,
AxesLabel -> {"x", "y",
"\!\(\*SubscriptBox[\(τ\), \(zy\)]\)(x,y)"},
LabelStyle -> Directive[FontFamily -> "Courier New"]]
Plot3D[Subscript[τ, xz], {x, y} ∈ Ω,
PlotTheme -> "Detailed", Mesh -> True,
AxesLabel -> {"x", "y",
"\!\(\*SubscriptBox[\(τ\), \(zx\)]\)(x,y)"},
LabelStyle -> Directive[FontFamily -> "Courier New"]]
VectorPlot[{Subscript[τ, xz], Subscript[τ, yz]}, {x, 0,
0.04}, {y, 0, 0.04}, PlotRange -> All, Axes -> True,
AxesLabel -> {x, y},
LabelStyle -> Directive[FontFamily -> "Courier New"]]

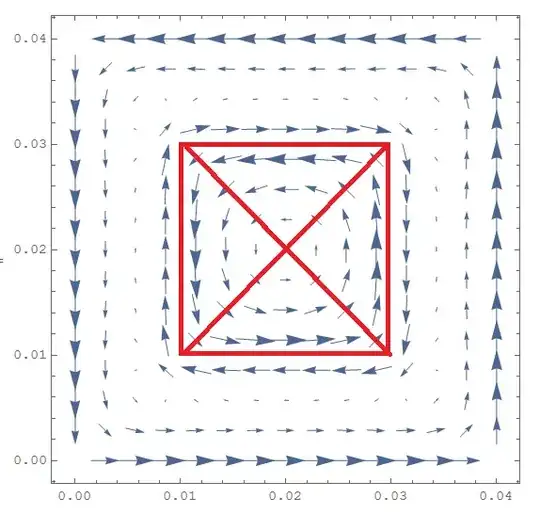


VectorPlot[{Subscript[\[Tau], xz], Subscript[\[Tau], yz]}, {x, y} \[Element] \[CapitalOmega], PlotRange -> All, Axes -> True, AxesLabel -> {x, y}, LabelStyle -> Directive[FontFamily -> "Courier New"]]that will only plot in the region. – user21 Mar 30 '15 at 18:22SystemInformation["Small"]report on your system? – user21 Mar 30 '15 at 18:42