Replace PlotLegends -> Automatic by
PlotLegends -> BarLegend[Automatic,
  LabelingFunction -> (Style[NumberForm[#, {Infinity, 3}], Bold, Black, 12] &)]
to produce
Many other formats are possible, depending on what you are seeking. (By the way, just ignore that LabelingFunction is in red in Mathematica. It works anyway.)
Addendum
In answer to the question in the comment below, I suggest the following:
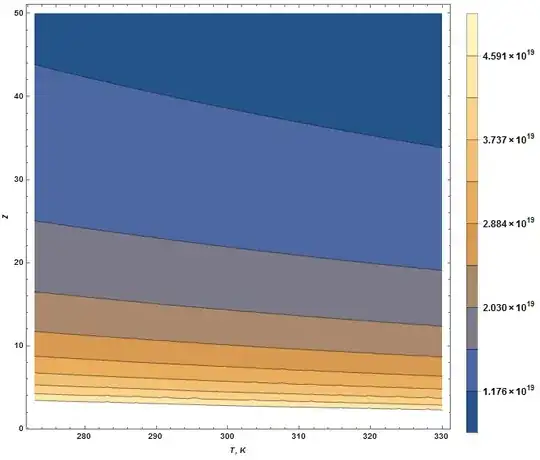
k = 1.380648813 10^-23;(*Boltzmann constant*)
T1 = 273; T2 = 330; rs = .1;
plt = ContourPlot[rs/(k T) Log10[1 + Z]/Z, {T, T1, T2}, {Z, 1, 50},
  ImageSize -> Large, FrameLabel -> {Style["T, K", Italic], Style["Z", Italic]},
  LabelStyle -> {Black, Bold, 12}, PlotRange -> All,
  ContourLabels -> Function[{x, y, z},
    Inset[Style[NumberForm[N[z/rs], {Infinity, 1}], Bold, 12],
      {Piecewise[{{x + 3, x < T1 + 3}, {x - 3, x > T2 - 3}}, x], y}]],
  PlotLegends -> BarLegend[Automatic, LabelingFunction ->
    (Style[NumberForm[N[#/rs], {Infinity, 1}], Bold, Black, 12] &)]]
Unfortunately, it includes two "work-arounds". First, a temporary rescaling, rs has been added to take account that ContourPlot does not pass ContourLabels of 10^19 or greater. I shall look further into this idiosyncrasy. Second, a Piecewise function has been added to better center the ContourLabels.
Additionally, PlotRange -> All has been added to recover the small portion of plot at the bottom and to improve the accuracy of the BarLegend labels. Labeling format also has been improved.

Second Addendum
As an alternative to adjusting the positions of ContourLabels for better centering, they can be allowed to extend outside the frame with the code
k = 1.380648813 10^-23;(*Boltzmann constant*)
T1 = 273; T2 = 330; rs = .1;
plt = ContourPlot[rs/(k T) Log10[1 + Z]/Z, {T, T1, T2}, {Z, 1, 50},
  ImageSize -> Large, FrameLabel -> {Style["T, K", Italic], Style["Z", Italic]},
  LabelStyle -> {Black, Bold, 12}, PlotRange -> All,
  ImagePadding -> All, PlotRangeClipping -> False,
  ContourLabels -> Function[{x, y, z},
    Inset[Style[NumberForm[N[z/rs], {Infinity, 1}], Bold, 12], {x, y}]],
  PlotLegends -> BarLegend[Automatic, LabelingFunction ->
    (Style[NumberForm[N[#/rs], {Infinity, 1}], Bold, Black, 12] &)]]
Alternatively, the frame can be made larger by replacing ImagePadding -> All, PlotRangeClipping -> False, by PlotRangePadding -> 3.2,.
Third Addendum
Jens' answer to Question 79052 can be used to eliminate the first "work-around" described above.
k = 1.380648813 10^-23; t1 = 273; t2 = 330; z1 = 1; z2 = 50;
f[t_, z_] := 1 Log10[1 + z]/(k t z)
plt = ContourPlot[f[t, z], {t, t1, t2}, {z, z1, z2},
  ImageSize -> Large, FrameLabel -> {Style["T, K", Italic], Style["Z", Italic]},
  LabelStyle -> {Bold, Black, 12}, PlotRange -> All,
  ContourLabels -> (Inset[Style[NumberForm[f[#1, #2], {Infinity, 1}], Bold, 12],
        {Piecewise[{{#1 + 3, #1 < t1 + 3}, {#1 - 3, #1 > t2 - 3}}, #1], #2}] &),
  PlotLegends -> BarLegend[Automatic,
    LabelingFunction -> (Style[NumberForm[#, {Infinity, 1}], Bold, Black, 12] &)]]
which yields a plot identical to the second one above. A Comment by Simon Woods in Question 79052 also provides an alternative.

