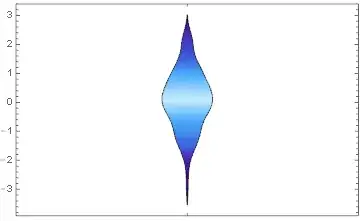
The "ColorScheme"of a DistributionChart can be changed using the ChartElementFunction like in the following example:
SeedRandom["DistributionChart"];
data = RandomReal[NormalDistribution[], {100}];

DistributionChart[data,
  ChartElementFunction ->
  ChartElementData["SmoothDensity", "ColorScheme" -> "DeepSeaColors"]]
But the "ColorScheme"seems to get irgnored if I change "SmoothDensity" for "DensityQuantile"
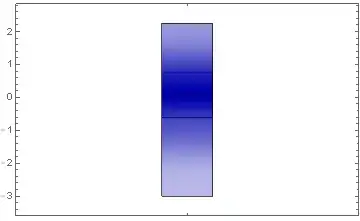
I tried to change the colors using ChartStyle but I only got the following, unsatisfactory result.
DistributionChart[data, ChartStyle -> "DeepSeaColors",
 ChartElementFunction -> ChartElementData["DensityQuantile"]]