I have a plot and I want to format it for journal paper. I just realized how hard to format a plot for academic purposes using MMA.
For example:
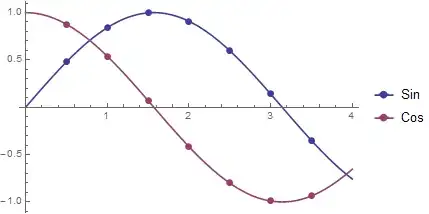
I want this plot Plot[{Sin[x], Cos[x]}, {x, 0, 4}] to be like this:

I tried using Mesh like this:
p=Plot[{Sin[x], Cos[x]}, {x, 0, 4},
 Mesh -> {Range[0, 4, 0.5], Range[0, 4, 1]},
 MeshStyle -> {{Directive[Red, PointSize[0.02]]}, {Directive[Green,
     PointSize[0.02]]}}, PlotLegends -> {"Sin", "Cos"}]
but of course no luck.
I had to use long way like this:
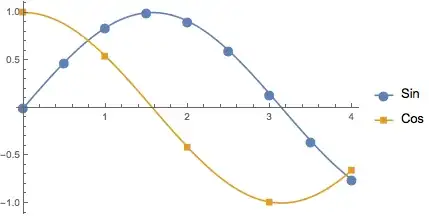
pl = ListLinePlot[Table[{x, #}, {x, 0, 4, 0.5}] & /@ {Sin[x], Cos[x]},
     PlotMarkers -> {Automatic, 15},
    PlotLegends -> {"Sin", "Cos"}] /. Line[x_] -> Sequence[];
Show[Plot[{Sin[x], Cos[x]}, {x, 0, 4}], pl]
My questions are:
1-Is there any easy and direct way to do this( I suppose this should be an issue for MMA as a lot of people use it for their academic work)
2-If you note in the plot p, the Mesh and MeshStyle can not be used for each plot separately when more than one functions are in the Plot. They just used the first element in the RHS of the option Rule. Any idea about this?


ColorData[97], but I thought thePlotThemeapproach might be more stable going forward (an unwarranted assumption, perhaps). – Michael E2 Apr 23 '15 at 11:56