In work that I am doing, I am trying to plot multiple zero-counting functions, depending on how a parameter works. For example, if the zeros of one function are {1, 2, 3, 4, 5, 6, 7}, the zeros of another function are {3, 5, 8, 12}, and the zeros of the third function are {7, 10}, my data looks like
SampleDats = {{1, 2, 3, 4, 5, 6, 7}, {3, 5, 8, 12}, {7, 10}};
For the counting function, the Count documentation gives an answer akin to
CountingFcn[dat_, r_] := Count[dat, u_ /; u < r];
which can be used on each row of the table in turn.
Of course, if I just write a Table, the HoldAll masks the differences between the list elements, and we get
PlotCountsBasic[dat_, {rMin_, rMax_}] :=
Plot[Table[CountingFcn[dat[[j, All]], r], {j, 1, Length[dat]}], {r,
rMin, rMax}, ImageSize -> Large] ;
PlotCountsBasic[SampleDats, {0, 13}]
which yields 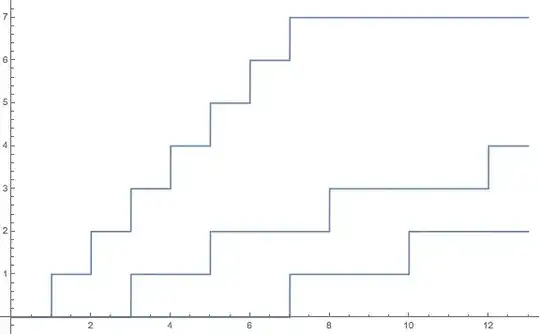
So far, of course nothing is outside the scope of Question 1731.
The trouble is that when I do set Evaluated -> True, I get the zero-function.
PlotCountsEval[dat_, {rMin_, rMax_}] :=
Plot[Table[CountingFcn[dat[[j, All]], r], {j, 1, Length[dat]}], {r,
  rMin, rMax}, ImageSize -> Large, Evaluated -> True] ;
PlotCountsEval[SampleDats, {0, 13}]
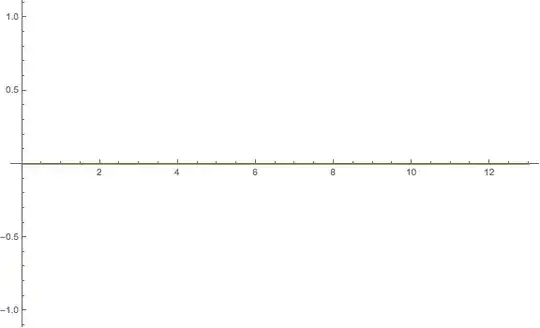
This is not really an issue with Plot, but Evaluate is evaluating "too quickly" for the counting command to give any real value. Compare:
Evaluate[Table[
CountingFcn[SampleDats[[j, All]], 7], {j, 1, Length[SampleDats]}]]
(*{6, 2, 0}*)
Clear[r];
Evaluate[Table[
CountingFcn[SampleDats[[j, All]], r], {j, 1, Length[SampleDats]}]]
(*{0, 0, 0}*)
Question: Given that the Evaluate trick won't work for the counting function as written, what is the best way around? Is the right way to revise the counting-function, or is the right way to use more esoteric commands in the Plot?
Configuration: Mac OS X Yosemite (department computer), Mathematica 10.0.2.0.

