I have this data:
data =
  {{{2015, 3, 25}, 130}, {{2015, 3, 26}, 132}, {{2015, 3, 27},
    132}, {{2015, 3, 30}, 133}, {{2015, 3, 31}, 132}, {{2015, 4, 1},
    131}, {{2015, 4, 2}, 131}, {{2015, 4, 3}, 131}, {{2015, 4, 6},
    131}, {{2015, 4, 7}, 131}, {{2015, 4, 8}, 129}, {{2015, 4, 9},
    132}, {{2015, 4, 10}, 133}, {{2015, 4, 13}, 132}, {{2015, 4, 14},
    131}, {{2015, 4, 15}, 131}, {{2015, 4, 16}, 128}, {{2015, 4, 17},
    125}, {{2015, 4, 20}, 127}, {{2015, 4, 21}, 127}};
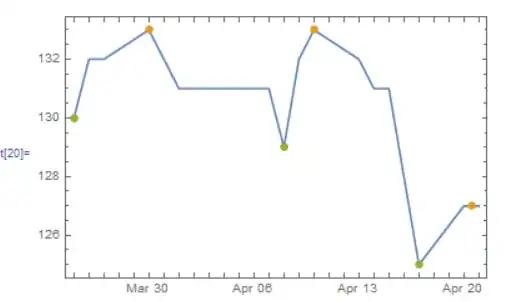
I want to produce with DateListPlot an image almost like this one:

Almost? If there are more than one maxima or minima only the first point should be plotted.
In reality my data is much longer.
What could an elegant and efficient answer look like?


dataisn't ordered? – Sjoerd C. de Vries Apr 22 '15 at 22:18dataappeared to be ordered.Sortit if it is not. – Mr.Wizard Apr 22 '15 at 22:36