0

I have plotted

    Clear[Expr1, Expr2]

    Expr1 = x*(1/Sin[Pi x/2])^α


(* x Csc[(π x)/2]^α *)

Expr2 = Normal[Series[Expr1, {x, 0, 5}]]


(* (1/
      x)^α ((2/π)^α x + 
       1/3 2^(-3 + α) π^(2 - α) x^3 α + 
       1/45 2^(-7 + α) π^(4 - α)
         x^5 α (2 + 5 α)) *)

Plot[
     Table[{Expr1, Expr2}, {α, -1, 1, 0.25}], {x, 0, 1}, 
     PlotLegends -> Table[α, {α, -1, 1, 0.25}]]

but all plots appeared in one color and with one legend key
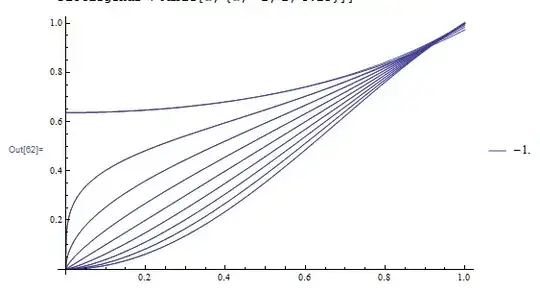
enter image description here

how to fix?

Dr. belisarius
  • 115,881
  • 13
  • 203
  • 453
Suzan Cioc
  • 2,023
  • 1
  • 16
  • 21

1 Answers1

1

I did a quick fix:

tbl = Table[{Expr1, Expr2}, {\[Alpha], -1, 1, 0.25}];
leg = Table[\[Alpha], {\[Alpha], -1, 1, 0.25}];

Plot[tbl, {x, 0, 1}, PlotLegends -> leg]

which seems to work: enter image description here

atapaka
  • 3,954
  • 13
  • 33
  • Huh?! I don't have M handy to check, but Plot[Table[...], ...] returns all in one color, while tbl=Table[...]; Plot[tbl...] works fine? I'd have always put an Evaluate such as Plot[Evaluate@tbl...] – LLlAMnYP Apr 22 '15 at 20:45