This is what I want.
I want to change the colors as I progress through a list.
This is what I want.
I want to change the colors as I progress through a list.
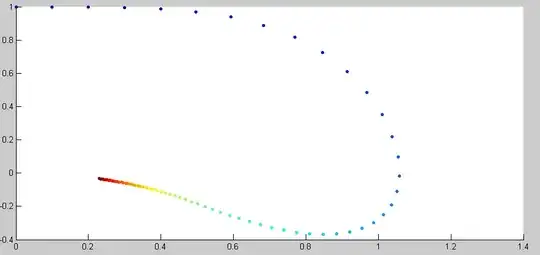
For illustrative purposes:
f[t_] := {Sqrt[2] Cos[t], Sqrt[2] Cos[t] Sin[t]}/(1 + Sin[t]^2)
r = Range[0, 2 Pi, 0.05];
cf = ColorData["Rainbow"][1 - #/(2 Pi)] &;
lp = ListPlot[{f@#} & /@ r, PlotStyle -> (cf /@ r),
   AspectRatio -> Automatic, ImageSize -> 400];
g = Graphics[{cf@#, PointSize[0.01], Point[f@#]} & /@ r,
   ImageSize -> 400];
pp = ParametricPlot[f[t], {t, 0, 2 Pi},
   ColorFunction -> (cf[2 Pi #3] &), PlotStyle -> Thickness[0.01],
   ImageSize -> 400];
Grid[Transpose[{{"ListPlot", "Graphics", "ParametricPlot"}, {lp, g,
    pp}}]]

I have always felt that Mathematica's ListPlot needed this feature. It is possible that a feature like this has been added in version 10.1, but prior to that, the best I know of is to use Graphics directly, which isn't nearly as hard as it sounds:
points = Table[{x^4, Sin[x^4]}, {x, 0, (2*Pi)^(1/4), 0.01}];
colors = Map[Hue[2/3*(#[[1]]/(2*Pi))] &, points];
Graphics[Thread[{colors, Point /@ points}]]

This is pretty close; if you want to make it look more like the ListPlot, you'll want to add axes and maybe change the aspect ratio:
Graphics[
  Thread[{colors, Point /@ points}],
  AspectRatio -> 1/GoldenRatio,
  Axes -> True]
