5

Let us examine the agreement between specified value for the AspectRatio option and the actual aspect ratio of generated plot. For this purpose I define a function which uses the Rasterize trick for determination of the actual aspect ratio:

realAspectRatio = #2/#1 & @@ (#2 - #1) & @@ 
    Rasterize[
      Show[#, Epilog -> {Annotation[
          Rectangle[ImageScaled[{0, 0}], ImageScaled[{1, 1}]], "Two", 
          "Region"]}], "Regions"][[-1, 2]] &;

(Instead of realAspectRatio@ one can use much more basic but lesser precise function #2/#1 & @@ ImageDimensions@ what gives the same results.)

At first, we check the agreement for simple graphics Graphics[{Point[{{0, 0}, {1, 1}}]}]:

table = Table[{10^p, realAspectRatio@
     Graphics[{Point[{{0, 0}, {1, 1}}]}, AspectRatio -> 10^p]}, {p, -2, 2, .1}];
lm = LinearModelFit[table, x, x];
lm["BestFit"]
ListPlot[lm["FitResiduals"], Frame -> True, 
         FrameLabel -> {"AspectRatio", "fit residual"}]

1.26421 + 0.603143 x

plot

One can see that actual aspect ratio substantially differs from the requested via the AspectRatio option and the dependence between them is nonlinear!

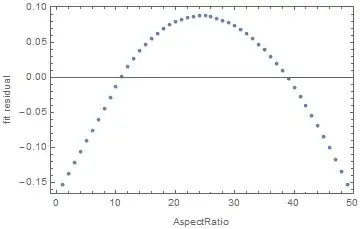
In this case the situation becomes MUCH better if we provide at least horizontal PlotRange specification PlotRange -> {{0, 1}, Automatic}:

table = Table[{10^p, 
    realAspectRatio@
     Graphics[{Point[{{0, 0}, {1, 10}}]}, AspectRatio -> 10^p, 
      PlotRange -> {{0, 1}, Automatic}]}, {p, -2, 2, .1}];
lm = LinearModelFit[table, x, x];
lm["BestFit"]
ListPlot[lm["FitResiduals"], Frame -> True, 
 FrameLabel -> {"AspectRatio", "fit residual"}]

0.00391481 + 1.00225 x

plot

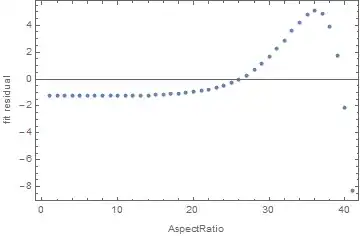
But for a little more complex graphics ListPlot[Prime[Range[25]]] this remedy does not help even if we vary AspectRatio in much lesser diapason from 1/5 to 5:

table = Table[{ar, realAspectRatio@
      ListPlot[Prime[Range[25]], PlotRange -> {{0, 25}, {0, 100}}, 
       AspectRatio -> ar]}, {ar, 1/5, 5, .1}];
lm = LinearModelFit[table, x, x];
lm["BestFit"]
ListPlot[lm["FitResiduals"], Frame -> True, 
 FrameLabel -> {"AspectRatio", "fit residual"}]

0.248369 + 0.768459 x

plot

How this behavior can be explained? Is it intended behavior? And more importantly: is there a way to make the actual aspect ratio predictable?


Summary of the discussion and the conclusion

The source of confusion was the first sentence under the "Details" section on the Documentation page for AspectRatio: "AspectRatio determines the scaling for the final image shape." This statement is clearly wrong and more correct statement can be found as the first point under the "Properties and Relations" subsection in the "Examples" section on the same page: "AspectRatio determines the ratio of PlotRange, not ImageSize." But as it is clearly demonstrated in dedicated answer, even this statement is not precise because actually AspectRatio determines the aspect ratio of the plotting area which is specified by both PlotRange and PlotRangePadding.

Alexey Popkov
  • 61,809
  • 7
  • 149
  • 368
  • 1
    In 10.1 it seems that neither Scaled not ImageScaled correctly place a Rectangle aligned with the range of the plot therefore any calculations based on these are inaccurate. Edit: I forgot about PlotRangePadding. With that set to zero the rectangle aligns. – Mr.Wizard May 18 '15 at 16:05
  • @Mr.Wizard With #2/#1 & @@ ImageDimensions@ instead of realAspectRatio@ I get roughly the same picture. I'm surprised that ImageScaled works incorrectly because my little experimentation with plots in the question showed correct behavior of realAspectRatio. – Alexey Popkov May 18 '15 at 16:09
  • Alexey, Have you tried removing any ImagePadding from your graphic? – MarcoB May 18 '15 at 16:24
  • @MarcoB We seem to be thinking alike. Please see my answer. – Mr.Wizard May 18 '15 at 16:25

1 Answers1

4

It seems to me that there is little point in making the image size so small that the image cannot possibly have a close to accurate aspect ratio. If I also get rid of the superfluous parts outside of the plot range by setting PlotRangePadding, ImagePadding, and ImageMargins all to zero, I can use simple ImageDimensions to check aspect ratio. Doing all this I find that it is quite precise in 10.1 under Windows:

table = Table[{10^p, 
    N[#2/#] & @@ 
     ImageDimensions@
      Image@Graphics[{Disk[]}, AspectRatio -> 10^p, PlotRangePadding -> 0, 
        ImagePadding -> 0, ImageMargins -> 0, ImageSize -> {2000}]}, {p, -2, 2, .1}];

lm = LinearModelFit[table, x, x];
lm["BestFit"]
ListPlot[lm["FitResiduals"], Frame -> True, FrameLabel -> {"AspectRatio", "fit residual"},
  DataRange -> {10^-2, 10^2}, PlotRange -> All]
-0.00279057 + 1.00046 x

enter image description here

Likewise your ListPlot example:

table = Table[{ar, 
    N[#2/#] & @@ 
     ImageDimensions@
      Image@ListPlot[Prime[Range[25]], PlotRange -> {{0, 25}, {0, 100}}, 
        AspectRatio -> ar, PlotRangePadding -> 0, ImagePadding -> 0, ImageMargins -> 0, 
        ImageSize -> {2000}]}, {ar, 1/5, 5, .1}];

lm = LinearModelFit[table, x, x];
lm["BestFit"]
ListPlot[lm["FitResiduals"], Frame -> True, FrameLabel -> {"AspectRatio", "fit residual"},
 DataRange -> {1/5, 5}]
0.000344083 + 0.999798 x

enter image description here

Mr.Wizard
  • 271,378
  • 34
  • 587
  • 1,371
  • Yes, that's what I was thinking as well. I had tried simply adding ImagePadding -> None to the Graphics in @AlexeyPopov's question, and the fit returns a coefficient of $1$, with fit residuals within a MachineEpsilon of zero. You have a good point about not making the image too small to be sensible though. – MarcoB May 18 '15 at 16:28
  • Now I see the problem: ImagePadding is ignored when the final aspect ratio is calculated and is added AFTER the calculation. It is very unexpected discovery for me. – Alexey Popkov May 18 '15 at 16:33
  • 1
    @Alexey Why would that be unexpected? Surely the aspect ratio of the plotted data itself is most important? – Mr.Wizard May 18 '15 at 16:33
  • You are right, the aspect ratio of the plot range is the most important thing. But according to the Documentation AspectRatio is about overall image size, not just about the plot range! – Alexey Popkov May 18 '15 at 16:36
  • @Alexey I don't know if I interpret the documentation that way. Do you have a specific section in mind? Ah, OK. I still think that is rather ambiguous, but that's a fault of the documentation writers not you for interpreting it. – Mr.Wizard May 18 '15 at 16:38
  • See the first line in the Details section on the Documentation page for AspectRatio: "AspectRatio determines the scaling for the final image shape." I do not think that the end of this sentence can be interpreted as "the final plotting range shape." – Alexey Popkov May 18 '15 at 16:40
  • 1
    @Alexey You certainly have a point, yet it wouldn't make sense for AspectRatio to work that way; if it did when using Automatic circles would vary from round with every tick mark and label added to a plot. – Mr.Wizard May 18 '15 at 16:47
  • I thought that Automatic is an exclusive mode for AspectRatio. Are you sure that AspectRatio -> 1 is equivalent to AspectRatio -> Automatic? For which purpose they introduced the Automatic setting? If you are right it just misleads a user. – Alexey Popkov May 18 '15 at 16:52
  • 1
    Did I state that AspectRatio -> 1 is equivalent to Automatic? I hope not as that would be incorrect. Automatic scales the graphic such that primitives are non-distorted, i.e. circles are circles. This isn't the first time the documentation has been unclear or flat out wrong, but I still think this is the logical way for AspectRatio to work. I guess I never read the documentation that carefully; I just experimented and observed. Actually that's probably how I learned most of what I knew about Mathematica before joining Stack Exchange. – Mr.Wizard May 18 '15 at 17:03
  • 2
    I see that learning by trial and error method is more efficient than mine: I read at least a few first lines in the Documentation and then I proceeded as if these were the true. Now I see that even the first few lines may be false during many versions and (!) for a basic function. It is frustrating for me. – Alexey Popkov May 18 '15 at 17:15
  • @Alexey You have my sympathy. Though I rank discovering that a newly introduced function performs far more poorly than existing alternatives as more frustrating. :-p – Mr.Wizard May 18 '15 at 17:16
  • 1
    @AlexeyPopkov to be fair, the documentation does say that "AspectRatio determines the ratio of PlotRange, not ImageSize" (see the first point under "Properties and Relations"). To me, that does seem to describe the observed (and most desirable) behavior. Do I misunderstand? – MarcoB May 18 '15 at 20:55
  • 1
    @MarcoB I agree. But this statement must be in the "Details" section, not hidden somewhere in the examples. – Alexey Popkov May 19 '15 at 00:08
  • 1
    @MarcoB After reading of the dedicated answer I realize that even this statement is not completely correct: actually AspectRatio determines the ratio of not just PlotRange but of the whole plotting are with PlotRangePadding included. It seems that many sentences in the Documentation are taken directly from the Documentation for version 5 where we had no such option as PlotRangePadding. – Alexey Popkov May 19 '15 at 06:54
  • @AlexeyPopkov regarding the difference between plot range and plot range plus padding, allow me to add to your confusion: Plot[Sin[x], {x, -3, 3}, PlotRange -> {{-2, 2}, {-.8, .8}}, PlotRangePadding -> .3] note how the curve is clipped beyond .8, however the part with x>2 is plotted, although that is also merely the padding, not the explicitly specified PlotRange. – LLlAMnYP May 19 '15 at 08:07
  • @LLlAMnYP I see your example as an indication that PlotRangePadding is not completely correctly integrated into Plot. But it does not alter my view of the AspectRatio behavior expressed in my last comment. – Alexey Popkov May 19 '15 at 08:14