6

I have a simple question. Why is Filling not working in the following?

ListLinePlot[{{{0,0},{1,1}},{{5,0},{6,1}}}, Filling->{1->{2}}]

I am simply plotting two lines defined by two pairs of points, and I want to fill between them. Why is this not working as expected? It seems really easy.

Erika H
  • 113
  • 1
  • 6

3 Answers3

5

You can simply add a background polygon:

ListLinePlot[{{{0, 0}, {1, 1}}, {{5, 0}, {6, 1}}}, 
 Prolog -> {LightBlue, Polygon[{{0, 0}, {1, 1}, {6, 1}, {5, 0}}]}]

plot

Or you can flip the axes twice using the following modification of Mr.Wizard's axisFlip function:

axisFlip[l_List] := 
  Replace[l, {x_?NumericQ, y_?NumericQ} :> {y, x}, {-2}];
axisFlip[g_Graphics] := g /. {
    x : (_Point | _Line | _GraphicsComplex) :> MapAt[axisFlip, x, 1],
    x : (PlotRange -> _) :> x~Reverse~2};

ListLinePlot[axisFlip@{{{0, 0}, {1, 1}}, {{5, 0}, {6, 1}}}, 
  Filling -> {1 -> {2}}] // axisFlip

ListPlot[{Table[Sin[x], {x, 0, 2 Pi, 0.1}], 
    Table[Sinc[x], {x, 0, 2 Pi, 0.1}]}, Filling -> {1 -> {2}}, 
  FillingStyle -> {Red, Blue}, Frame -> True] // axisFlip

Plot[Sin[x], {x, 0, 2 Pi}, Filling -> Axis] // axisFlip

plot plot plot

Alexey Popkov
  • 61,809
  • 7
  • 149
  • 368
  • "but this method is dangerous and can have unexpected side-effects in some cases" -- such as? Is it because your replacement is a bit too general? I do not see any problems if I use my own axisFlip function for the outer operation. – Mr.Wizard May 21 '15 at 07:10
  • 1
    @Mr.Wizard Thank you. For the purposes of this answer I have extended your function for ListPlot and for Lists. – Alexey Popkov May 21 '15 at 07:38
5

Modifying the MapAt+GeometricTransformation approach in this answer in the related Q/A linked by @Mr.Wizard:

ClearAll[filledLLP]
filledLLP[l_, o : OptionsPattern[{Graphics, ListLinePlot}]] := 
 Graphics[MapAt[GeometricTransformation[#, ReflectionMatrix[{-1, 1}]] &, 
    ListLinePlot[Reverse[l, 3], FilterRules[{o}, Options[ListLinePlot]]], {1}][[1]],
  FilterRules[{o}, Options[Graphics]], 
  AspectRatio -> 1/GoldenRatio, Axes -> True, PlotRange -> All]

Examples:

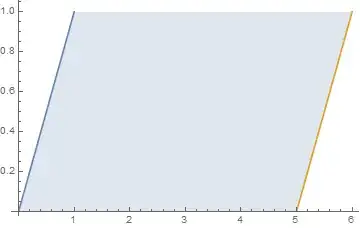
lists = {{{0, 0}, {1, 1}}, {{5, 0}, {6, 1}}};
llp0 = ListLinePlot[lists, ImageSize -> 400, BaseStyle -> Thick];
llpX = filledLLP[lists, Filling -> {1 -> {2}}, FillingStyle -> Yellow,
    ImageSize -> 400, BaseStyle -> Thick];

Row[{llp0, llpX}, Spacer[10]]

enter image description here

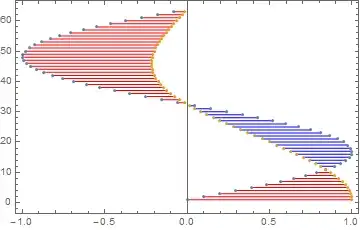
filledLLP[{{{0, 0}, {1, 1}}, {{1, .2}, {4, .5}}, {{5, 0}, {6, 1}}}, 
 Filling -> {2 -> {{3}, Opacity[1, Red]}, 
   2 -> {{1}, Opacity[1, Yellow]}, 1 -> {{3}, Opacity[.25, Cyan]}}, 
 ImageSize -> 400, BaseStyle -> Thick]

Mathematica graphics

kglr
  • 394,356
  • 18
  • 477
  • 896
3

Using version 10.

The filling is the intersection of the half-plane to the right of the left line with the half-plane to the left of the right line.

RegionPlot[
 RegionIntersection[
  HalfPlane[{{0, 0}, {1, 1}}, {1, 0}],
  HalfPlane[{{5, 0}, {6, 1}}, {-1, 0}]],
 PlotRange -> {{0, 6}, {0, 1}}]

enter image description here

Bob Hanlon
  • 157,611
  • 7
  • 77
  • 198