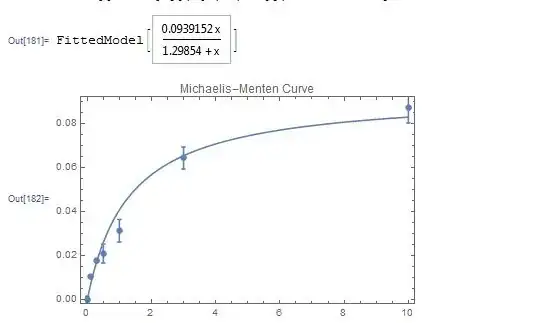
I have some enzyme kinetics data that I want to fit to the Michaelis-Menten curve in order to obtain the kinetic parameters of the enzyme.
Is it meaningful, statistically and functionally speaking, to use the error bars (standard deviation) of the measurements as weights in the NonlinearModelFit function, and are there any caveats that I need to take note of when using the function this way?
Needs["ErrorBarPlots`"]
rateList =
  Transpose[{{0, 0.1, 0.3, 0.5, 1, 3, 10}, {0, 0.0107, 0.0179,
     0.02103, 0.0314, 0.0645, 0.0875}}];
errorList = {0.0015, 0.00043, 0.00071, 0.0043, 0.0051, 0.0050, 0.0071};
weightList = 1/errorList;
mmfit = NonlinearModelFit[rateList, a*x/(b + x), {a, b}, x,
  Weights -> weightList]
Show[ErrorListPlot[
  Table[{rateList[[i]], ErrorBar[errorList[[i]]]}, {i,
    Length[rateList]}], AxesLabel -> {"[Substrate] (mM)", "Activity (Units)"},
   PlotLabel -> "Michaelis-Menten Curve"],
 Plot[{mmfit[x]}, {x, 0, 10}], Frame -> True]
Also, the AxesLabel property of the plot does not seem to be displaying the axes' names in the resulting plot. What am I doing wrong in this case that is preventing the axes from being correctly displayed?
weightList = 1/errorList^2seems more appropriate. – J. M.'s missing motivation May 21 '15 at 19:19Plot[]first in yourShow[], and move the options inErrorListPlot[]out as options toShow[]. – J. M.'s missing motivation May 21 '15 at 20:07PlotRange->Fullto thePlotfunction. – MarcoB May 21 '15 at 20:10