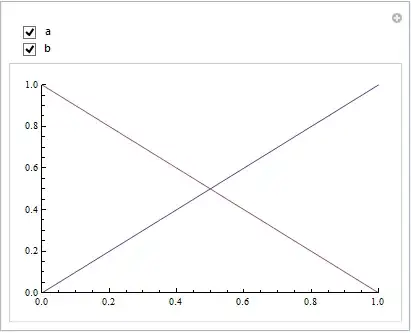
Manipulate[a = Plot[x, {x, 0, 1}]; b = Plot[1 - z, {z, 0, 1}];
 Show[If[cond1 == 1, a, Graphics[]], If[cond2 == 1, b, Graphics[]],
  Axes -> (cond1+cond2>=1), PlotRange -> {{0, 1}, {0, 1}}, AspectRatio -> 1/GoldenRatio],
 Grid[{{Control[{{cond1, 1, ""}, {0, 1}}], "a"},
       {Control[{{cond2, 1, ""}, {0, 1}}], "b"}}]]

Change Axes -> (cond1 + cond2 >= 1) to Axes->True if you want to have the axes always visible.
You can get the same result by changing the PlotStyle of plots a and b based on the cond1 and cond2, respectivly.
Manipulate[ a = Plot[x, {x, 0, 1}, PlotStyle -> If[cond1 == 0, Opacity[0], Opacity[1]]];
 b = Plot[1 - z, {z, 0, 1}, PlotStyle -> If[cond2 == 0, Opacity[0], Opacity[1]]];
 Show[a, b, Axes -> (cond1+cond2>=1), PlotRange -> {{0, 1}, {0, 1}},
     AspectRatio -> 1/GoldenRatio],
 Grid[{{Control[{{cond1, 1, ""}, {0, 1}}], "a"},
       {Control[{{cond2, 1, ""}, {0, 1}}], "b"}}]]
Alternatively, use a single plot with two curves:
Manipulate[Plot[{x, 1 - x}, {x, 0, 1},
   PlotStyle -> {If[cond1 == 0, Opacity[0], Opacity[1]],
                 If[cond2 == 0, Opacity[0], Opacity[1]]},
   Axes -> (cond1+cond2>=1), PlotRange -> {{0, 1}, {0, 1}}, AspectRatio -> 1/GoldenRatio],
 Grid[{{Control[{{cond1, 1, ""}, {0, 1}}], "a"},
       {Control[{{cond2, 1, ""}, {0, 1}}], "b"}}]]
If you have to use Show:
Manipulate[ab = Plot[{x, 1 - x}, {x, 0, 1},
   PlotStyle -> {If[cond1 == 0, Opacity[0], Opacity[1]],
     If[cond2 == 0, Opacity[0], Opacity[1]]}];
 Show[ab, Axes -> (cond1 + cond2 >= 1), PlotRange -> {{0, 1}, {0, 1}},
      AspectRatio -> 1/GoldenRatio],
 Grid[{{Control[{{cond1, 1, ""}, {0, 1}}], "a"},
       {Control[{{cond2, 1, ""}, {0, 1}}], "b"}}]]
Axes -> TrueinShow, or useGraphics[{}, Axes -> True]instead ofGraphics[]insideIf. – kglr May 24 '15 at 16:14PlotRange-> ...toShowor to the emptyGraphics. – kglr May 24 '15 at 17:12Show[If[cond1 == 1, a, Graphics[]], If[cond2 == 1, b, Graphics[]], Axes -> True, PlotRange -> {{0, 1}, {0, 1}}, AspectRatio -> 1/GoldenRatio],works as expected in version 9.0.1.0 on Windows 8 (64bit). – kglr May 24 '15 at 17:25