pts = {{1.5, 1.5}, {1.5, -1.5}, {2.5, 0}, {2.5, 1.94}, {2.5, -1.94}, {-2.5, 0}, {2, 2},
{-2, 2}, {2, -2}, {-2, -2}, {2.5, 2}, {-2.5, 2}, {-2.5, -2}, {2.5, -2}};
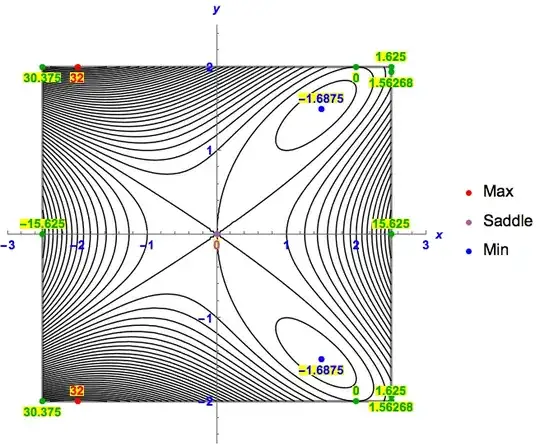
ContourPlot[{y^4 - 3 x y^2 + x^3}, {x, -2.5, 2.5}, {y, -2, 2},
Contours -> {Automatic, 50}, BoundaryStyle -> Directive[Red, Thick], Frame -> False,
ContourShading -> None, Axes -> True, AxesLabel -> {x, y},
PlotRange -> {{-3, 3}, {-2.5, 2.5}}, LabelStyle -> Directive[Blue, Bold],
Epilog -> {PointSize[0.015], Green, Point[#] & /@ pts, Black,
Text["-1.6875", "-1.6875", "15.625", "15.625", "1.5625", "-1.5625",
"0", "32", "0", "32", "1.625", "30.375", "30.375", "1.625"] & /@ pts,
PlotLegends -> "Expressions"}]`

My problem is now that I have more than 2 points. And (almost) every point has a different value. Example
{1.5,1.5} shall be named -1.6875
{1.5,-1.5} shall be named -1.6875
{2.5,0} shall be named 15.625
{2.5,0} shall be named 1.5625
It continues this way.
PlotLegends shall show the Expressions (Min, Max, Saddle point). Min, Max and Saddle point shall have three different colors. The points you pick don't matter. I simply want to know how it's done. Take some for Min, some for Max and one for the Saddle point. But don't confuse the right "value" as a text output (it shall be automatic the right form)
MapThreadcould be of help (instead of/@). And perhapsPointLegend[{Red, Green, Blue}, {"Min", "Max", "Saddle"}]. -- Some parts are not completely clear. You simply want to know how what is done? And I don't understand the last sentence. Can you help? – Michael E2 May 29 '15 at 19:23