I have a mapping function (cubic logistic map) $f(x)=rx(1-x^2)$ and I need to make multiple bifurcation diagrams, showing stable equilibria and periodic orbits for $400$ equally spaced $r$ values between $0$ and $3$. Once for $x_0=0.7$ and another diagram for $x_0=-0.7$ I tried to do this, but it is only plotting one of the stable points at a time instead of the typical chaotic branching I'd like to make. How could I modify my code to do this?
My attempt:
iterfunc[r_] := Nest[r # (1 - #^2) &, 0.7, 1200];
iterfunc2[r_] := Nest[r # (1 - #^2) &, -0.7, 1200];
rvalues = Range[0, 3., 3/400];
rResults = iterfunc /@ rvalues;
rResults2 = iterfunc2 /@ rvalues;
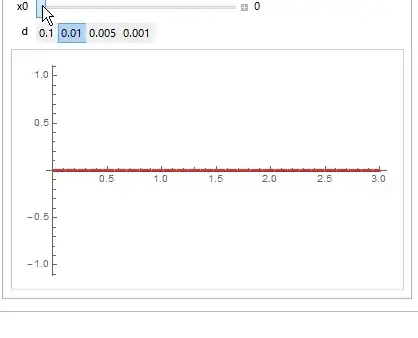
ListPlot[Transpose[{rvalues, rResults}], AxesLabel -> {r},
PlotStyle -> Directive[Blue]]
ListPlot[Transpose[{rvalues, rResults2}], PlotStyle -> Directive[Red]]
ListPlot[
{Transpose[{rvalues, rResults}],
Transpose[{rvalues, rResults2}]},
PlotStyle -> {Directive[Blue], Directive[Red]}]