EDIT
New Answer
Using the RegionBounds and IntersectingQ functions we can easily achieve this. First we collect the cells of the Voronoi diagram and compute their region bounds, then comparing with that of the overall Voronoi diagram we can select the interior polygons.
(* vm is the Voronoi diagram of your image *)

cells = MeshPrimitives[vm, 2]; (* cells of the Voronoi diagram *)
regb = RegionBounds[vm]; (* region bounds of the Voronoi diagram *)
inout = IntersectingQ[Flatten@regb, Flatten@RegionBounds[#]] & /@ cells;
in = Pick[cells, inout, False]; (* select the inner polygons *)
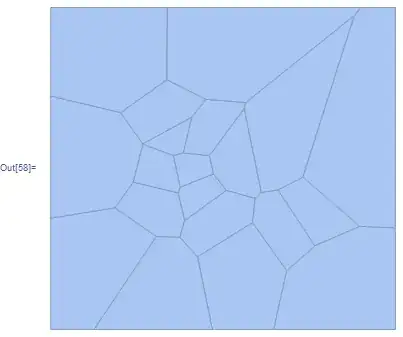
Here is the plot:
Graphics[{Blue, EdgeForm[Black], in}]

Old Answer
Here is one approach:
I will use my sample data here, see below for your image data.
pts = RandomReal[4, {20, 2}];
vor = VoronoiMesh[pts]
We determine the boundary points using RegionBoundary and we set the points from the Voronoi diagram that are on the boundar to {0,0}. We do this so we can eliminate the Polygons that coincide with the boundary (this is your goal).
nobdr = With[{bdr = MeshCoordinates@RegionBoundary@vor,
              cod = MeshCoordinates[vor]},
             If[MemberQ[bdr, #], {0, 0}, #] & /@ cod]
We now get the positions of those boundary points
ind = Position[nobdr, {0,0}] // Flatten;
And delete the polygons as explained above:
pol = DeleteCases[MeshCells[vor, 2],
  Polygon[{___, Alternatives @@ ind, ___}]]
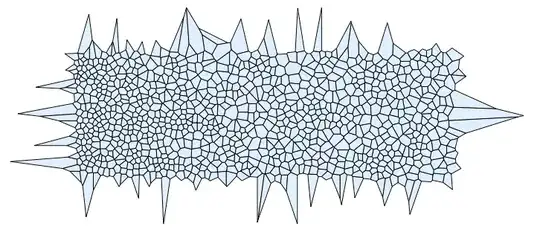
Now the images:
gr = Graphics[{LightRed, EdgeForm[Black], GraphicsComplex[nobdr, pol]}]

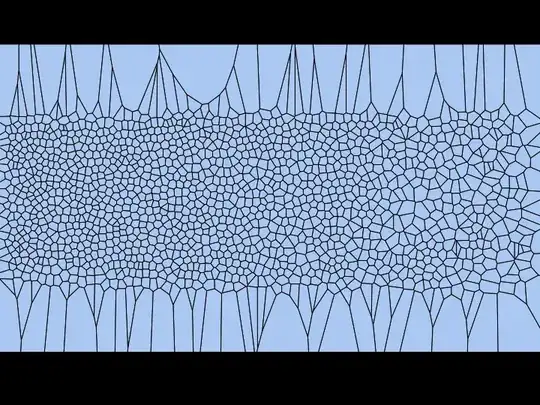
With the Voronoi diagram
Show[vor, gr]]

The same approach applied to your data gives:


"Interior"that one should know about? – halirutan Jun 10 '15 at 01:20"InteriorFaces"can work too.You can get it byvm[pts]["Properties"],But I don't know how to do it. – yode Feb 22 '17 at 12:54