0

When I try to plot the DSolve output, I get empty plot.

Here is the code

Eq1 = -(r + k)/k*(1 + 1/beta)*D[(D[u[r], r] - (u[r] + 1)/(r + k)), r] == p
bcs1 =  u[-1] == 1;
bcs2 = u[1] == 1;
sol = DSolve[{Eq1, bcs1, bcs2}, u[r], r]
k = 0.1; beta = 0.1; p = 0.1;
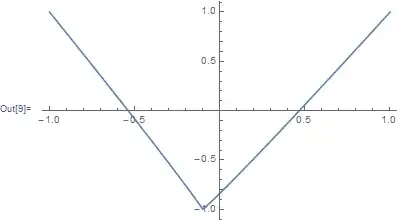
Plot[u[r] /. sol, {r, -1, 1}]

I have no idea where, I made a mistake.

Please guide me.

Thanks

Mahdi
  • 1,619
  • 10
  • 23
zhk
  • 11,939
  • 1
  • 22
  • 38
  • 2
    When something won't plot, it's useful to look at the numerical values. ThingThatWontPlot/.variable->SomeSensibleValue//N – John Doty Jun 09 '15 at 16:20

1 Answers1

5

One way to see the problem, is to evaluate the solution, using Table for some values:

 Chop@Table[u[r] /. sol, {r, -1, 1, .1}]

Mathematica graphics

So the solution is complex valued. So to plot it, use Re and Im

 Plot[Re[u[r] /. sol], {r, -1, 1}]

Mathematica graphics

 Plot[Im[u[r] /. sol], {r, -1, 1}]

Mathematica graphics

Nasser
  • 143,286
  • 11
  • 154
  • 359