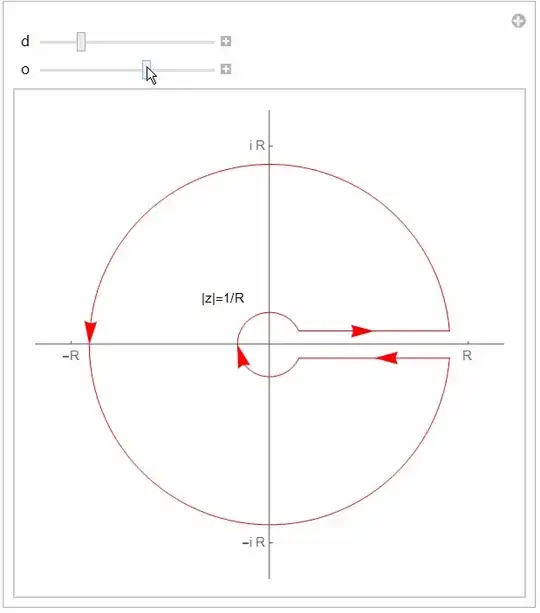
I am $\TeX$ writing notes on complex analysis, I need to use figures of contour paths to integrate on them, how can I plot them on Mathematica, something like this

adding also the $\gamma_R$ legends in $\TeX$ if possible ?
I am $\TeX$ writing notes on complex analysis, I need to use figures of contour paths to integrate on them, how can I plot them on Mathematica, something like this
adding also the $\gamma_R$ legends in $\TeX$ if possible ?
Preliminaries:
lin[x_] := {Arrowheads[{{0.05, 0.5}}], Arrow[Most@x]};
arc[x_] :=
  {Arrowheads[{{0.05, 0.5}}],
   Arrow[Table[
     x[[1]] {Cos[j], x[[-2]] Sin[j]}, {j, x[[2]], x[[3]],
      0.01 (x[[3]] - x[[2]])}]]};
cont[lst_] := If[#[[-1]] == "line", lin@#, arc@#] & /@ lst
Example of right most contour but you could adapt to others by specifying contour as list of elements (am time poor at present):
 im[d_, o_] :=
     Graphics[{Red,
       cont[{{{o, d}, {1, d}, "line"}, {1, ArcTan[d], 2 Pi - ArcTan[d], 1,
           "arc"}, {{1, -d}, {o, -d}, "line"}, {Norm[{o, d}], ArcTan[d/o],
           2 Pi - ArcTan[d/o], -1, "arc"}}], Black,
       Text["|z|=1/R", 2 Norm[{o, d}] {Cos[3 Pi/4], Sin[3 Pi/4]}]},
      Axes -> True,
      Ticks -> {{{1.1, "R"}, {-1.1, "-R"}}, {{1.1, "i R"}, {-1.1,
          "-i R"}}}, PlotRange -> {{-1.3, 1.3}, {-1.3, 1.3}}]
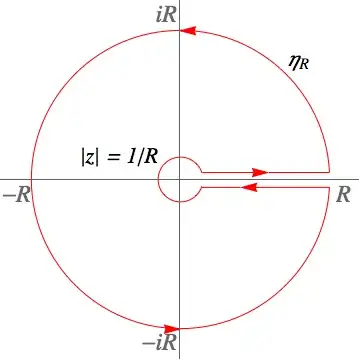
You can format text and contour as desired.
Graphics[
   {Text[Style["|z| = 1/R", 22, Italic, FontFamily -> "Times"], {-.4, .15}],
    Text[Style["\!\(\*SubscriptBox[\(\[Eta]\), \(R\)]\)", 22, Italic,
    FontFamily -> "Times"], {.8, .8}],
  {Red,
   {Arrowheads[.05], Arrow[{{.01, 1}, {-.01, 1}}]},
   {Arrowheads[.05], Arrow[{{-.01, -1}, {.01, -1}}]},
   {Arrowheads[.05], Arrow[{{.15, .05}, {.6, .05}}]},
   {Arrowheads[.05], Arrow[{{1, -.05}, {.4, -.05}}]},
   Line[{{.6, .05}, {1, .05}}],
   Line[{{.4, -.05}, {.15, -.05}}],
   Circle[{0, 0}, .15, {.3, 2 \[Pi] - .3}],
   Circle[{0, 0}, 1, {.05, 2 \[Pi] - .05}]}},
 Axes -> True,
 Ticks -> {{{1.1, Text[Style["R", Italic, 24]], 0},
           {-1.1, Text[Style["-R", Italic, 24]], 0}},
          {{ 1.1, Text[Style["iR", Italic, 24]], 0},
           {-1.1, Text[Style["-iR", Italic, 24]], 0}}},
 PlotRange -> {{-1.2, 1.2}, {-1.2, 1.2}}]
Arrow[]andJoinedCurve[]will be quite helpful here. – J. M.'s missing motivation Jun 10 '15 at 02:40