(9 Tanh[x]^8 (1 - 2 Tanh[x]^2)^2 (1 - Tanh[x]^2))/(1 + 3 I Sqrt[2/13])^2
How can I plot the function with the range of x {-10,10}?
(9 Tanh[x]^8 (1 - 2 Tanh[x]^2)^2 (1 - Tanh[x]^2))/(1 + 3 I Sqrt[2/13])^2
How can I plot the function with the range of x {-10,10}?
Here is a sightly modified version of the utility function I used in an answer to How does Mathematica understand branchcuts of the complex logarithm:
ClearAll[plotZ]
Options[plotZ] = {ImageSize -> 300, Background -> Lighter[Orange],
   ContourStyle -> Blue, ExclusionsStyle -> Red,
   PlotLabel ->
    Framed[Grid[{{Style["-", Bold, Blue],
        "Real part"}, {Style["-", Bold, Gray], "Imaginary part"}},
      Alignment -> Left], FrameStyle -> None, Background -> White,
     RoundingRadius -> 5]};
SyntaxInformation[plotZ] = {"LocalVariables" -> {"Plot", {2, 2}},
   "ArgumentsPattern" -> {_, _, OptionsPattern[]}};
SetAttributes[plotZ, HoldAll];
plotZ[f_, range_, OptionsPattern[]] :=
 Module[{fn, x, y, zVar, min, max},
  zVar = ReleaseHold[Hold[range] /. {x_, y__} :> HoldPattern[x]];
  fn = ReleaseHold[Hold[f] /. zVar -> x + I y];
  {min, max} = Rest[range];
  Show[ContourPlot[Im[fn], {x, min, max}, {y, min, max},
    ContourShading -> Automatic,
    ExclusionsStyle -> OptionValue[ExclusionsStyle]],
   ContourPlot[Re[fn], {x, min, max}, {y, min, max},
    ContourShading -> False,
    ContourStyle -> OptionValue[ContourStyle],
    ExclusionsStyle -> OptionValue[ExclusionsStyle]],
   FrameLabel -> {"Re(z)", "Im(z)"},
   Background -> OptionValue[Background], PlotRangePadding -> 0,
   PlotLabel -> OptionValue[PlotLabel],
   ImageSize -> OptionValue[ImageSize]]]
You can use this function just like Plot, except that the plot limits now apply equally to the real and imaginary parts. These two parts of the complex function are plotted as different sets of contours on top of each other:
plotZ[(9 Tanh[z]^8 (1 - 2 Tanh[z]^2)^2 (1 - Tanh[z]^2))/(1 +
     3 I Sqrt[2/13])^2, {z, -10, 10}]
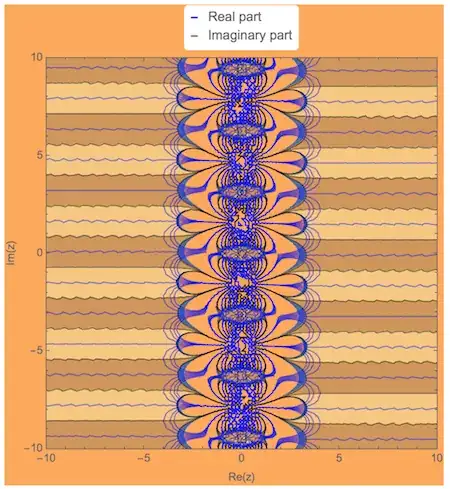
The imaginary part is drawn with shaded contours, and the real part as blue contours on to of it. You can see that the two families of contours are perpendicular to each other. You can customize the colors and the label. See the line Options[plotZ] for a list of acceptable options.
Edit: plot absolute value
For the absolute value, you could use a DensityPlot as the background, and superimpose the real part:
ClearAll[plotZAbs]
Options[plotZAbs] = {ImageSize -> 300,
   ColorFunction -> "SandyTerrain",
   Background -> Lighter[Orange],
   ContourStyle -> LightGray,
   ExclusionsStyle -> Red,
   PlotLabel ->
    Framed[Row[{Style["-", Bold, LightGray], " Real part"},
      Alignment -> Left], FrameStyle -> Directive[Thick, Orange],
     Background -> Transparent, RoundingRadius -> 5]};
SyntaxInformation[plotZAbs] = {"LocalVariables" -> {"Plot", {2, 2}},
   "ArgumentsPattern" -> {_, _, OptionsPattern[]}};
SetAttributes[plotZAbs, HoldAll];
plotZAbs[f_, range_, OptionsPattern[]] :=
 Module[{fn, x, y, zVar, min, max},
  zVar = ReleaseHold[Hold[range] /. {x_, y__} :> HoldPattern[x]];
  fn = ReleaseHold[Hold[f] /. zVar -> x + I y];
  {min, max} = Rest[range];
  Show[DensityPlot[Abs[fn], {x, min, max}, {y, min, max},
    ColorFunction -> OptionValue[ColorFunction],
    ClippingStyle -> Automatic
    ],
   ContourPlot[
    Re[fn], {x, min, max}, {y, min, max},
    ContourShading -> None,
    ExclusionsStyle -> OptionValue[ExclusionsStyle],
    ContourStyle -> OptionValue[ContourStyle],
    ExclusionsStyle -> OptionValue[ExclusionsStyle]],
   FrameLabel -> {"Re(z)", "Im(z)"},
   Background -> OptionValue[Background], PlotRangePadding -> 0,
   PlotLabel -> OptionValue[PlotLabel],
   ImageSize -> OptionValue[ImageSize]]]

plotZAbs[(9 Tanh[z]^8 (1 - 2 Tanh[z]^2)^2 (1 - Tanh[z]^2))/(1 +
     3 I Sqrt[2/13])^2, {z, -10, 10}]

Well, to plot the Abs, use Plot...
Plot[Abs[(9 Tanh[x]^8 (1 - 2 Tanh[x]^2)^2 (1 - Tanh[x]^2))/(1 +
      3 I Sqrt[2/13])^2], {x, -10, 10}]
to plot the real part, replace Abs with Re
Plot[{Re[(9 Tanh[x]^8 (1 - 2 Tanh[x]^2)^2 (1 - Tanh[x]^2))/(1 +
       3 I Sqrt[2/13])^2],
  Im[(9 Tanh[x]^8 (1 - 2 Tanh[x]^2)^2 (1 - Tanh[x]^2))/(1 +
       3 I Sqrt[2/13])^2]}, {x, 0, 10},
 PlotRange -> All]
