I want to apply Mathematica's DFT procedure, Fourier[], to a Gaussian. Why a Gaussian? Because I know the analytical result.
So I define
a = 0.5;
h[t_] := Exp[-(t^2/a^2)];
The analytic FourierTransform of h using FourierParameters -> {0, -2 Pi} is:
HAnalytic[v] := Sqrt[Pi]*a*Exp[-a^2*Pi^2*v^2];
Then I create time values:
dt = 1/100;
tList = Table[t, {t, 0, 20000 dt, dt}];
and I create sample data:
inputData = h[tList]
I then create the frequency values:
dv = 1/((Length[tList] - 1)*dt);
vList = dv*Table[i, {i, 0, Length[tList] - 1}];
and carry out the DFT calculation:
HDFT = Re[Fourier[inputData]];
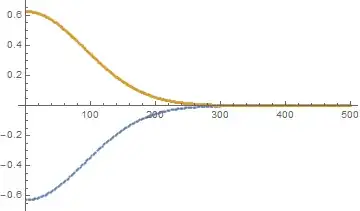
Now I plot it:
Show[
 Plot[HAnalytic[v], {v, 0, 1000*dv}, PlotRange -> {{0, 1.5}, {-1, 1}},
   PlotStyle -> Green],
 ListPlot[{Thread[{vList, HDFT}][[1 ;; 500]]}]
 ]

So far no problem. Only the scaling is different.
BUT NOW MY QUESTION!
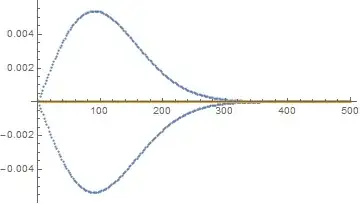
Why do I get

i.e. the Fourier-transformed values are mirrored around the frequency axis, when using
tListSym = Table[t, {t, -10000 dt, 10000 dt, dt}]
I mean h[tListSym] gives really kind of the whole function to the DFT, as h is symmetric around $t = 0$, whereas h[tList] reproduces only the right hand side of h.
If I look at the values of HDFT, I can see that the values are alternatively positive / negative.
Can someone explain to me what is going on?


t =ListSym = Table[t, {t, -10000 dt, 10000 dt, dt}]. – newandlost Jun 17 '15 at 12:24Abs[]of your DFT values, rather than theRe[]. – MarcoB Jun 17 '15 at 14:45