I try to plot this data with ListPlot
data={{1, 1/1000}, {2, 0}, {3, 1/500}, {4, 1/1000}, {5, 0}, {6,
   3/1000}, {7, 1/250}, {8, 3/1000}, {9, 1/500}, {10, 1/250}, {11,
   1/500}, {12, 1/500}, {13, 1/125}, {14, 3/500}, {15, 1/250}, {16,
   1/200}, {17, 3/500}, {18, 3/1000}, {19, 1/250}, {20, 9/1000}, {21,
   3/1000}, {22, 1/200}, {23, 13/1000}, {24, 1/200}, {25, 3/500}, {26,
    1/250}, {27, 1/125}, {28, 1/125}, {29, 11/1000}, {30, 3/500}, {31,
    1/125}, {32, 9/1000}, {33, 1/200}, {34, 1/125}, {35, 7/1000}, {36,
    2/125}, {37, 9/500}, {38, 1/125}, {39, 17/1000}, {40, 7/500}, {41,
    3/250}, {42, 7/500}, {43, 9/1000}, {44, 11/1000}, {45, 1/50}, {46,
    3/250}, {47, 3/250}, {48, 3/200}, {49, 7/500}, {50, 2/125}, {51,
   2/125}, {52, 11/1000}, {53, 11/500}, {54, 2/125}, {55, 1/125}, {56,
    2/125}, {57, 9/500}, {58, 3/200}, {59, 17/1000}, {60, 1/50}, {61,
   9/500}, {62, 9/500}, {63, 1/50}, {64, 13/500}, {65, 21/1000}, {66,
   11/500}, {67, 13/500}, {68, 9/500}, {69, 13/500}, {70,
   23/1000}, {71, 39/1000}, {72, 29/1000}, {73, 3/100}, {74,
   4/125}, {75, 29/1000}, {76, 13/500}, {77, 3/125}, {78,
   23/1000}, {79, 31/1000}, {80, 1/40}, {81, 1/40}, {82, 7/200}, {83,
   33/1000}, {84, 21/1000}, {85, 1/50}, {86, 11/500}, {87,
   3/125}, {88, 13/500}, {89, 7/250}, {90, 33/1000}, {91, 4/125}, {92,
    27/1000}, {93, 31/1000}, {94, 3/100}, {95, 3/100}, {96,
   1/40}, {97, 31/1000}, {98, 29/1000}, {99, 9/250}, {100,
   3/100}, {101, 29/1000}, {102, 39/1000}, {103, 13/500}, {104,
   7/250}, {105, 23/1000}, {106, 3/100}, {107, 3/125}, {108,
   17/500}, {109, 11/500}, {110, 3/125}, {111, 7/200}, {112,
   1/40}, {113, 3/100}, {114, 9/500}, {115, 3/100}, {116,
   3/100}, {117, 23/1000}, {118, 21/1000}, {119, 1/50}, {120,
   33/1000}, {121, 13/500}, {122, 3/125}, {123, 27/1000}, {124,
   21/1000}, {125, 13/500}, {126, 19/500}, {127, 1/40}, {128,
   23/1000}, {129, 19/1000}, {130, 19/1000}, {131, 11/500}, {132,
   2/125}, {133, 17/1000}, {134, 19/1000}, {135, 17/1000}, {136,
   27/1000}, {137, 11/500}, {138, 21/1000}, {139, 23/1000}, {140,
   21/1000}, {141, 1/40}, {142, 7/500}, {143, 3/125}, {144,
   19/1000}, {145, 19/1000}, {146, 3/250}, {147, 21/1000}, {148,
   2/125}, {149, 13/1000}, {150, 9/500}, {151, 3/200}, {152,
   9/1000}, {153, 9/1000}, {154, 1/125}, {155, 7/500}, {156,
   9/1000}, {157, 3/250}, {158, 9/1000}, {159, 1/100}, {160,
   3/250}, {161, 3/500}, {162, 11/1000}, {163, 13/1000}, {164,
   1/500}, {165, 7/1000}, {166, 1/200}, {167, 1/125}, {168,
   9/1000}, {169, 3/500}, {170, 3/500}, {171, 1/250}, {172,
   1/250}, {173, 1/250}, {174, 7/1000}, {175, 0}, {176, 3/1000}, {177,
    0}, {178, 1/1000}, {179, 1/500}, {180, 1/1000}};
Using the same code
ListPlot[data, PlotStyle -> Red, Filling -> Axis]
Mma 10.0.1 produces

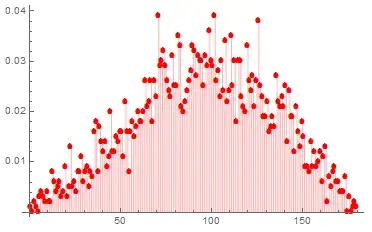
and Mma 10.1 gives
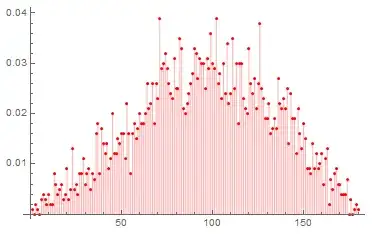
As you can see, above plots are not identical. Since I favor the 10.0.1 version, I tried to make a modification in 10.1 by invoking PlotMarkers option and hoping I'll get more similar result.
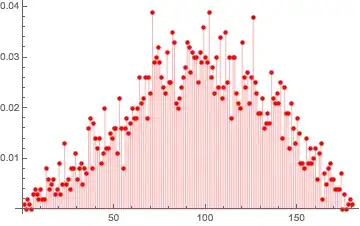
ListPlot[data, PlotStyle -> Red, Filling -> Axis, PlotMarkers -> {Automatic, 8}]
The result is unsatisfactory.
Somehow, the plot is slightly moved to the left and the markers are not perfectly rounded.

Is this an expected behavior from the newest version if Mma? Or, did I miss something?

FullFormof the plots; the only difference isPointSize[0.009166666666666668]in version 10.1 andPointSize[0.01388888888888889`]in version 10.0.1. So you can take the plot from 10.1 and just dopl1 /. PointSize[0.009166666666666668`] -> PointSize[0.01388888888888889`]`. – b.gates.you.know.what Jun 20 '15 at 09:56