I used a code very similar to the code posted by Kuba stacked line graph with fragmented data
TestData = {{{1, 23}, {4, 3}, {10, 34}, {12, 34}, {20, 5}}, {{5,
     3}, {6, 3}, {7, 4}, {15, 12}, {21, 5}}};
Plot[Piecewise[{{Interpolation[#, x,
         InterpolationOrder -> 0], #[[1, 1]] <= x <= #[[-1, 1]]}, {#[[
         1, 2]], x < #[[1, 1]]}, {#[[-1, 2]], x > #[[-1, 1]]}}] & /@
    TestData // Accumulate // Reverse, {x, 0, 25},
 AxesOrigin -> {0, 0}, Frame -> True,
 Filling -> {1 -> Axis, 2 -> {1}}, FillingStyle -> {Red, Blue},
 Evaluated -> True, PlotStyle -> Thick, Frame -> True,
 BaseStyle -> {18, Bold}, PlotRange -> All]
Using v.9.0 I get the desired output:
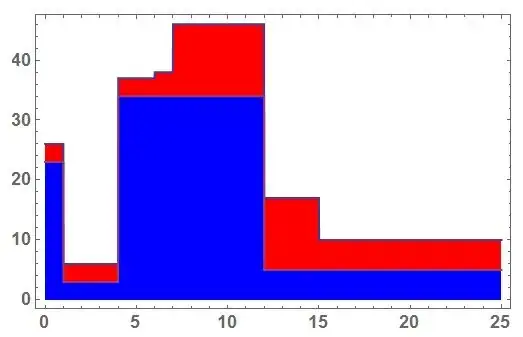
If a execute the same code in v.10.1 the filling looks different.

What change between v.9 and v.10 is responsible for the different behaviour? Couldn't find a way to get the same output as in v.9.0 until now.

Evaluated -> Truefor years because it preserves localization of the plot variable. We must wrap the entire thing inBlock[{x}, . . . ]in this case now to handle it properly. Nevertheless +1. – Mr.Wizard Jun 23 '15 at 09:47