3

I am trying to extract the points from the mesh lines of a 3D plot. (Not my actual function.)

   p = Plot3D[Sin[x]^2*Cos[y], {x, -1, 1}, {y, -1, 1},  MeshFunctions -> {#1^2+#2^2 &}]

my plot

I found a similar question here. So I used the code suggested:

p2 = p // Cases[#, GraphicsComplex[Line_, ___] :> Line] &;  
p3 = Flatten[p2, 1];  
ListPlot[p3[[All, 1 ;; 2]]]  

my attempt at extracting mesh lines

As you can see, I am getting a bunch of points that are not on the mesh lines. When I increase the PlotPoints, it gets even worse.

How can I extract only the points on the mesh lines?

J. M.'s missing motivation
  • 124,525
  • 11
  • 401
  • 574

2 Answers2

3

Expanding @Guess comment:

p1 = Join @@ Cases[Normal@p, Line[x1__] :> x1, Infinity];
ListPlot[Most /@ p1]

Mathematica graphics


p1 = Join @@ Cases[Normal@p, Line[x1__] :> 
                  {RGBColor @@ RandomReal[{0, 1}, 3], Line[Most /@ x1]}, Infinity];
Graphics[p1, AspectRatio -> 1/GoldenRatio]

Mathematica graphics

Dr. belisarius
  • 115,881
  • 13
  • 203
  • 453
  • The OP may want to set BoundaryStyle -> None if the boundary surrounding the contours is unwanted. If the surface is also not wanted and only the contours are desired, PlotStyle -> None can be added. – J. M.'s missing motivation Jul 03 '15 at 05:19
3

Working with GraphicsComplex retains a degree of flexibility. For instance,

Graphics3D[GraphicsComplex[p[[1, 1]], Line[Rest@Cases[p, Line[z__] :> z, Infinity]]]]

enter image description here

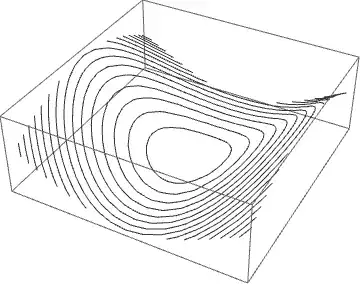
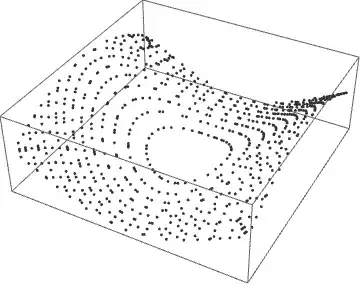
gives the Mesh in 3D. (Rest@ deletes the perimeter of the surface.) If, instead, a plot of the points in 3D is desired, use

Graphics3D[GraphicsComplex[p[[1, 1]], 
  Point[Flatten[Rest@Cases[p, Line[z__] :> z, Infinity]]]]]

enter image description here

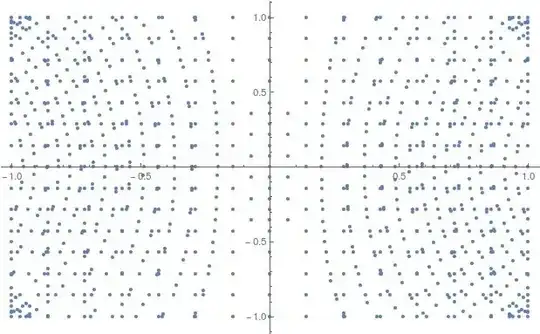
The same plot in 2D is obtained by dropping the last coordinate of each point.

p1 = Graphics[GraphicsComplex[Most /@ p[[1, 1]], 
   Point[Flatten[Rest@Cases[p, Line[z__] :> z, Infinity]]]]]

enter image description here

Addendum

A List of the points themselves can be obtained directly from p.

Most /@ (p[[1, 1, #]] & /@ Flatten[Rest@Cases[p, Line[z__] :> z, Infinity]])

or from p1, the 2D plot,

p1[[1, 1, #]] & /@ Flatten[Cases[p1, Point[z__] :> z, Infinity]]

which is equivalent to

Cases[Normal[p1], Point[z__] :> z, Infinity]

suggested by Guesswhoitis and belisarius.

Note: It might be tempting to try simply, Most /@ (p[[1, 1, #]], but doing so also recovers hundreds of additional points used to construct the 3D surface.

Explanation

In response to a comment below, this is how (more or less) I obtained the results above. To begin with, run

p//InputForm

to see what is inside, but be prepared for a lot of data. Basically, you will see the function GraphicsComplex, followed by several options at the very end. So, for instance,

Graphics3D[p[[1]]]

plots only the contents of the GraphicsComplex, which in this case is just the surface and the mesh lines.

The first argument of GraphicsComplex (see documentation) is a large array of 3D point locations, from which almost everything in the plot is constructed. The next argument consists of several other functions. What we care about here are Line functions, one for the boundary of the surface and one for each line in the mesh. The argument of Line is a list of indices, referring to the 3D points; i.e., Line[{3 ,127, 52}] draws a smooth curve from point 3 to point 127 to point 52.

The command

Line[Rest@Cases[p, Line[z__] :> z, Infinity]]

extracts a list of the lists of indices, throws away the first list (which is the outline of the surface), and puts them inside another Line function. Additionally p[[1, 1]] obtains the list of 3D points Finally, both of these items are repackaged in ``GraphicsComplex` and plotted.

Graphics3D[GraphicsComplex[p[[1, 1]], Line[Rest@Cases[p, Line[z__] :> z, Infinity]]]]

giving the mesh lines in 3D shown in the first plot above.

If, instead, the Line indices are repackaged inside Point,

Point[Flatten[Rest@Cases[p, Line[z__] :> z, Infinity]]]

and combined with p[[1, 1]] inside GraphicsComplex, then

Graphics3D[GraphicsComplex[p[[1, 1]], 
  Point[Flatten[Rest@Cases[p, Line[z__] :> z, Infinity]]]]]

gives a 3D plot of mesh points instead, as in the second plot above.

To obtain a 2D plot instead, use Most to discard the third dimension.

Graphics[GraphicsComplex[Most /@ p[[1, 1]], 
   Point[Flatten[Rest@Cases[p, Line[z__] :> z, Infinity]]]]]

which gives the third plot above. I hope that this brief explanation is helpful.

bbgodfrey
  • 61,439
  • 17
  • 89
  • 156
  • As I noted in bel's answer, BoundaryStyle -> None will get rid of the lines enclosing the contours. – J. M.'s missing motivation Jul 03 '15 at 05:42
  • 1
    @Guesswhoitis. Interestingly, BoundaryStyle -> None yields 806 points in my last plot, whereas Rest@ leads to 801. Who knows? Thanks for your comment. – bbgodfrey Jul 03 '15 at 05:53
  • Where indeed did those 5 points come from… :o – J. M.'s missing motivation Jul 03 '15 at 05:59
  • @bbgodfrey Those are beautiful. Thank you so much for taking the time to help. Even though this is all I really needed, I'm also curious how this works. How does Mathematica store the information of the 3D plot? It looks like p is stored as a list with the point stored in the first 2 levels somewhere. Then Cases[p, Line[z___], Infinity] picks out the mesh points. Is that right? What is the purpose of the :> z at the end? – puppypalace Jul 03 '15 at 16:17
  • @puppypalace My response grew to be so long that I added it to the end of my Answer. Best wishes. – bbgodfrey Jul 03 '15 at 18:04
  • @bbgodfrey Wow, InputForm looks incredibly useful. One thing I noticed when looking at the mesh lines individually is that sometimes Mathematica splits one mesh line into 4 pieces, one per Quadrant. For instance, I use pp = p[[1, 1, #]] & /@ Rest@Cases[p, Line[z__] :> z, Infinity] and grab pp[[24]]. Then I plot this set of points hoping to see the 24th mesh line. Instead, I only get one piece of the contour. pp[[25]] doesn't give me the next piece either. Do you know how to group the points by mesh lines so that pp[[1]] is one mesh line, pp[[2]] is another, etc...? – puppypalace Jul 03 '15 at 18:25
  • @puppypalace Are your sure that you have not picked one of the lines near a corner, which naturally are broken into four quadrants? In any case, the answer to your question is, "No". I do not know the ordering of Lines in p, although you could try plotting some to see what you get. Note that 28 lines are in one quadrant only, and just 8 are continuous loops. – bbgodfrey Jul 03 '15 at 18:34
  • @bbgodfrey Yes, you are right. When I did ListPlot[pp[[All, All, 1 ;; 2]]], Mathematica did not color the outer curves correctly, so it must not know they are in the same group. I also tried Table[ListPlot[pp[[i, All, 1 ;; 2]], AspectRatio -> 1], {i, Length[pp]}] and it doesn't look like the groups of points are in any sequential order. Any ways, thanks again for your info and explanations above. You've been a huge help. – puppypalace Jul 03 '15 at 18:52