My questions are:
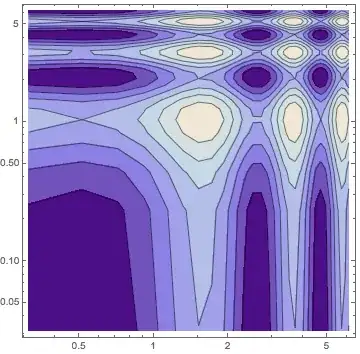
1) how can I change the compressed scale to fine one like {y = 0.1, 1, 10}, {x = 0.01, 0.1, 1, 10, 100}.
data = Flatten[
         Table[
           {x, y, Sin[3 x] + Cos[3 y]},
           {x, .1 Pi, 2 Pi, .2}, {y, .01 Pi, 2 Pi, .2}
         ],
         1
       ];

pdata = ListContourPlot[data, Mesh -> None, PlotRange -> All, InterpolationOrder -> 3];

ticks = FrameTicks /. AbsoluteOptions[pdata, FrameTicks];

logticks = Apply[If[#1 == 0, {#1, , ##3}, {Log[10, #1], ##2}] &, ticks, {2}];

ListContourPlot[{Log[10, #1], Log[10, #2], #3} & @@@ data,
  Mesh -> None, PlotRange -> All, InterpolationOrder -> 3,
  ColorFunction -> ColorData[{"LakeColors", "Reverse"}],
  FrameTicks -> logticks]
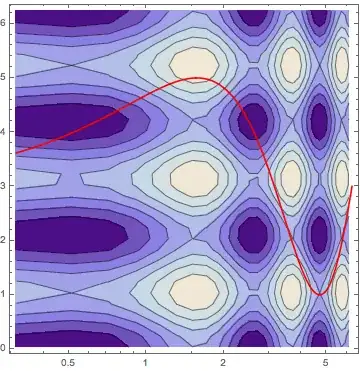
2) how can I combine two plots in one figure. The two plots are a ListContourPlot and LogLinearPlot.
This is my figure with Michael E2 code.
I want to plot a curve
LogLinearPlot[1 + 0.5/xx^0.33, {xx, 0.01, 105}, PlotStyle -> Red]
on the figure without any change in figure

AbsoluteOptionshas been essentially abandoned by WRI and doesn't work properly anymore. You may notice that it fails to extract the ticks, so yourticksvariable is a list of empty lists; consequentlylogticksdoesn't make sense either. That solution simply won't work. You could look at the alternative solution proposed in the same post instead. – MarcoB Jul 11 '15 at 21:30