Last month, I answered a question about spline interpolation,please see here
Now I do the following operations
pts=
{{0, 0.}, {3, 4}, {-1, 5}, {-4, 0}, {-5, -3}, {-10, -11}, {-11, -12}}
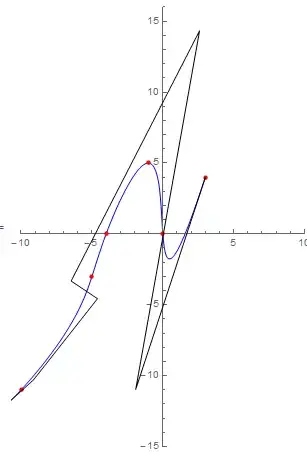
xy = Interpolation[pts, Method -> "Spline", InterpolationOrder -> 4];
graph1=
Plot[xy[t], {t, Min[pts[[All,1]]], Max[pts[[All,1]]]},
Epilog -> {PointSize[Medium], Point[pts]},
AspectRatio -> Automatic, ImageSize -> 300, PlotRange -> {{-10, 10}, {-15, 10}}]

However, when I used my function visualizeBSpline, it given a different result.
graph2 = visualizeBSpline[pts, 4, ImageSize -> 300]

Show[{graph1,graph2}]

Question
- Why the result of
Interpolation[pts, Method -> "Spline"]is different fromBSplineCurve. - How to make the result of
Interpolation[pts, Method -> "Spline"]andBSplineCurvesame.
Edit
Thanks for march's hint
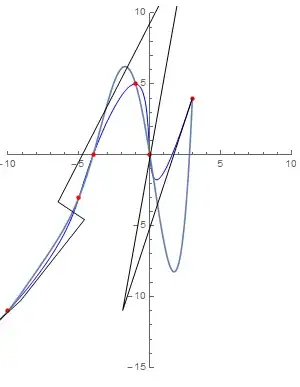
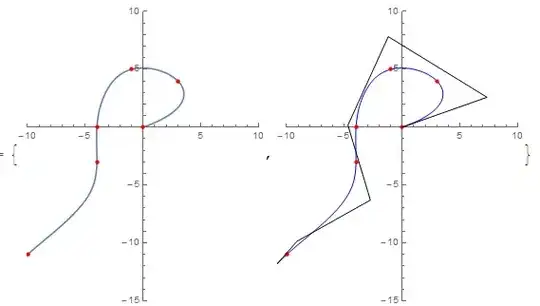
graph3 =
  visualizeBSpline[Sort[pts], 4, ImageSize -> 300, PlotRange -> {{-10, 10}, {-15, 16}}]
When I sort the pts, the results of Interpolation and BSplineCurve are still different.
Show[{graph3, graph1}]


visualizeBSpline[Sort[pts], 4, ImageSize -> 300]? – march Jul 13 '15 at 03:13Interpolationhas theMethod->Spline, I think they use the same theory The NURBS, so I simply think their result should be same . – xyz Jul 13 '15 at 03:35Interpolationunsort thepts. – xyz Jul 13 '15 at 03:37