3

In a ListLinePlot I can set InterpolationOrder -> 0 to get the equivalent of gnuplot's steps option, where the stepped line for each two points steps at the second point. Is there a Mma equivalent to gnuplot's fsteps option, where the stepped line for each two points steps at the first point? (In tikz terminology, I want |- instead of -| to connect successive points.)

Example application: Verhulst diagrams.

Edit 1:

Answers to the question referenced by @MarcoB show that ListLinePlot with InterpolationOrder->0 constructs a standard Manhatten path (alternating horizontal and vertical segments between points). This is equivalent to gnuplot's steps option. I'm after the equivalent of gnuplot's fsteps option: alternating vertical and horizontal segments.

To be clear: I am not asking how to produce this plot by creating new data through list manipulations. (See posts on cobweb plots with Mma for that.) I'm looking for built-in Mma functionality. (I accept that this may not exist.)

Edit 2:

logisticPath = NestList[2.75*#*(1 - #) &, 0.4, 10]
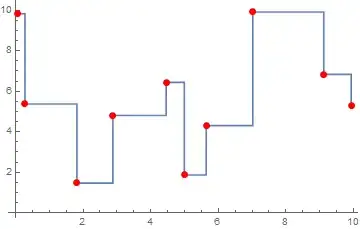
ListStepPlot[Transpose[{logisticPath, logisticPath}], "Left", 
 PlotRange -> All,
 Prolog -> Line[{{0.4, 0.4}, {0.8, 0.8}}]]

Produces cobweb plot (almost)

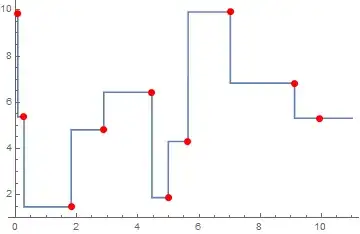
This is almost right. I just need to get rid of that initial segment, which is outside the data. What I want looks like this (using the same data):

cobwebPoints = Partition[Riffle[logisticPath, logisticPath], 2, 1]
ListLinePlot[cobwebPoints, PlotRange -> All,
 Prolog -> {Line[{{0, 0}, {1, 1}}]},
 PlotRange -> All]

cobweb plot

Alan
  • 13,686
  • 19
  • 38
  • 1
  • @MarcoB I think the answers to your referenced question shows that my first sentence is correct but does not explain how to get fsteps behavior. Correct me if I'm wrong. – Alan Jul 14 '15 at 23:01
  • Alan, I think @MichaelE2's answer in that post does provide you a method to get the fsteps behavior, at least as far as I understand what that behavior is. Take a look at my answer below, and let me know if I am misunderstanding. If, however, by "built-in MMA functionality" you mean an option to ListLinePlot, then the answer is in fact negative. However, you could just start considering Michael's helper functions "built-in" from now on :-) – MarcoB Jul 15 '15 at 05:29
  • 2
    Mathematica v10.2 (just released) brings a new function: ListStepPlot. See the step argument, which can take Right, Left and Center values. – kirma Jul 15 '15 at 05:39
  • @kirma Had I seen that comment I might not have joined in voting to close. I think that would make an excellent answers that is appropriate here but not for the other question. If you would like to post that as an answer I shall reopen this. – Mr.Wizard Jul 15 '15 at 09:29
  • @Mr.Wizard I'll write my answer in a moment if you reopen the question. – kirma Jul 15 '15 at 11:42
  • @kirma Done. Sorry for the wait. – Mr.Wizard Jul 15 '15 at 12:07
  • @kirma This looks to be very close to what I'm looking for. In contrast to other suggestions, it seems not to sort on the x-values, correct? (I don't have 10.2.) That is important for say a Verhulst diagram. If that's right, my only quibble is that there seems to be a little extra bit of line before the first point. Not sure why WRI finds that a good idea ... Can it be turned off? – Alan Jul 15 '15 at 18:26
  • @Alan My answer is below; I'm not sure about your requirements. If it is not what you wanted, tell me what should be different! – kirma Jul 15 '15 at 18:46
  • @kirma Your answer is helpful. I was trying to ask two questions. i. Let x= NestList[2.75*#*(1 - #) &, 0.4, 5] and then ListStepPlot[Transpose[{x,x},Left]. Does it produce a cobweb? ii. When I look at your posted answer, I seem to see a little segment before the first point, right? Can we somehow not draw that? – Alan Jul 15 '15 at 19:44
  • @Alan Your NestList makes no sense - is there something (a list) missing there? Line segment on the right... that is probably some sort of a bug. Maybe WRI guys can do something about it! – kirma Jul 15 '15 at 20:53
  • @kirma The NestList command works fine. See the edited question, which now illustrates the problem I'm having with your otherwise excellent suggestion to try ListStepPlot. – Alan Jul 18 '15 at 14:04

3 Answers3

4

Fresh v10.2 introduces ListStepPlot which provides just the right facility for this task:

pts = {{1.81515, 1.46912}, {4.99276, 1.87137}, {9.12065, 
    6.83238}, {9.9288, 5.30858}, {5.6387, 4.30558}, {4.45562, 
    6.44036}, {0.0721842, 9.82819}, {2.88155, 4.80602}, {7.01912, 
    9.91699}, {0.277599, 5.36962}};

ListStepPlot[SortBy[First][pts], Left, Mesh -> Full, MeshStyle -> Red]

enter image description here

kirma
  • 19,056
  • 1
  • 51
  • 93
1

Alan, I think you can use Michael's stepFunctions from the answer I linked to in the comments to solve your problem. Here is a link to MichaelE2's original answer: https://mathematica.stackexchange.com/a/30103/27951. Below is an adaptation to your problem using the step* functions defined in Michael's original answer. Note that this approach requires no modification to your existing points.


First of all, let's have some random points to play with:

pts = {{1.81515, 1.46912}, {4.99276, 1.87137}, {9.12065, 6.83238}, {9.9288, 5.30858}, 
       {5.6387, 4.30558}, {4.45562, 6.44036}, {0.0721842, 9.82819}, {2.88155, 4.80602}, 
       {7.01912, 9.91699}, {0.277599, 5.36962}};

ListLinePlot[
 SortBy[First][pts],
 InterpolationOrder -> 0, PlotRange -> All,
 Epilog -> {PointSize[0.02], Red, Point@pts}
]

native ListLinePlot behavior

Above is the native behavior of InterpolationOrder -> 0 that is undesirable to you in this case.


It seems to me that the function you are looking for is stepFloor in the post linked above. You use it as follows:

Plot[
 stepFloor[pts][x], {x, 0, 11},
 Epilog -> {PointSize[0.02], Red, Point@pts}
]

stepFloor result


You can also compare all the functions Michael had proposed. Note that stepCeiling repoduces the behavior of the native InterpolationOrder -> 0 in ListLinePlot.

original = ListLinePlot[
   Sort@pts,
   InterpolationOrder -> 0,
   Epilog -> {PointSize[0.02], Red, Point@pts},
   PlotLegends -> LineLegend[
     {Blue, Directive[Black, Dashed], Directive[Darker@Green, Dashed], Directive[Darker@Red, Dashed]},
     {"original", "stepFloor", "stepCeiling", "stepNearest"}
     ]
  ];

floor = Plot[stepFloor[pts][x], {x, -1, 10}, PlotStyle -> {Thick, Dashed, Black}];
ceiling = Plot[stepCeiling[pts][x], {x, -1, 10}, PlotStyle -> {Thick, Dashed, Darker@Green}];
nearest = Plot[stepNearest[pts][x], {x, -1, 10}, PlotStyle -> {Thick, Dashed, Darker@Red}];

Show[original, floor, ceiling, nearest]

compare all stepFunctions

MarcoB
  • 67,153
  • 18
  • 91
  • 189
0

One way is to simply shift the data:

data = {{0, 1}, {1, -1}, {2, 2}, {3, 1}, {4, 3/2}};
ListLinePlot[ data, InterpolationOrder -> 0]
ListLinePlot[ 
   Transpose[{data[[All, 1]], 
     Append[data[[All, 2]][[2 ;;]], data[[-1, 2]]]}], 
        InterpolationOrder -> 0]

enter image description here

george2079
  • 38,913
  • 1
  • 43
  • 110