Simple Context
This is a question about understanding how Inset really works and how GraphicsColumn and the like automatically calculate pos, opos, and size (and what those really mean) in Inset[fig, pos, opos, size]. Related posts that I have perused at (variable) length include
- How to align coordinate systems of Inset and enclosing Graphics?
Jens's answer to Do I have to code each case of this Grid full of plots separately?
I am still digesting the first, and the second doesn't solve the particular problem I am facing (although it is exceedingly useful).
Greater Context
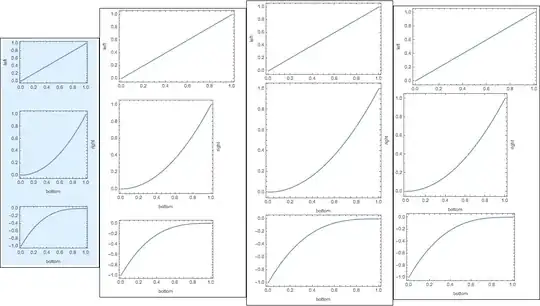
I have an established workflow that allows me to generate journal-ready figures with correct widths, correct font sizes, good quality, and small-enough file size. The journals in which I publish are usually two-column format, so I often have multiple figures that include (at least) two plots in a column format. An archetypical example is shown Framed below on the right:

(By the way, the color function was adapted from the seaborn color schemes as worked out in the answers to this question.)
The workflow typically involves something like the following.
Generate the figures using
Jens's amazingcontourDensityPlot. (This allowsExporting to pdf that eliminates the lines of the density plot mesh.)Set the correct
FontSizeandImageSizeso that the exported figure will match the font size and column width used in the journal, based on suggestions found inSzabolcs's $\LaTeX$ and Mathematica answer. (This is a key point: re-sizing the compound figure later can be an issue, since the fonts in the figure should match the fonts in the paper.)Use a generalization of the automated
ImagePaddingfromSzabolcs's answer here to align the figures in aGraphicsColumn. UseEpilogin theGraphicsColumnto add the annotations $(a)$ and $(b)$. (This is important: I cannot useColumnbecause this disallowsEpilog.)Manually go into the automated
Insets thatGraphicsColumncreates and hack the size so that the compound figure width matches the widths of the component figures. This step is to get rid of the extra white space (highlighted by including theFrame) as shown in the figure on the left above. (The main question posed in this post is about automating this step. I walk through an example below.)Exportas pdf and include in a document type-setted in $\LaTeX$.
(Somewhat Vague) Question
Inset sizing is mysterious to me, so I use GraphicsColumn to get the sizing about right and then, by trial and error, change the size until I get what I want. Based on the example below, can someone explain why GraphicsColumn creates a Graphics object that has all of the extra white space, why my hack works, and how the fix can be automated? This question will become less vague with a specific example:
Example
We consider two plots:
p1 = Plot[Table[{x, x^2}, {x, 0, 1, 0.5}]
  , Frame -> True, FrameLabel -> {None, "y"}
  , BaseStyle -> {FontSize -> 10}
  , ImageSize -> 255
  ]
p2 = ListPlot[Table[{x, x^2}, {x, 0, 1, 0.25}]
  , Frame -> True, FrameLabel -> {"x", None}
  , BaseStyle -> {FontSize -> 10}
  , ImageSize -> 255
  ]
The framed parts of these figures have the same implicit AspectRatio, but that will not be the case in general. In addition, due to the different FrameLabels, the actual aspect ratios of the figures are necessarily different. Therefore, we need to add equal ImagePaddings to the two plots. If we were to able to use Column, we could set just the left and right padding using the trick by Szabolcs and Heike mentioned above to automatically extract the padding:
padding[g_Graphics] := With[
 {im = Image[Show[g, LabelStyle -> White, Background -> White]]}
 , BorderDimensions[im]
]
leftRightPadding[graphicsSequence__Graphics] := {
  1 + Max /@ Transpose@(First /@ #) & @ (padding /@ List@graphicsSequence)
  , {Automatic, Automatic}
}

ipLR = leftRightPadding[p1, p2]
(* {{36, 4}, {Automatic, Automatic}} *)
Then, we can make perfectly sized and spaced image using Column that can be directly exported:
Column[Show[#, ImagePadding -> ipLR] & /@ {p1, p2}]
Export["fig1.pdf", %]
resulting in (this is actually exported as a png)

which will be the perfect size for including in a $\LaTeX$ document. Unfortunately, I cannot use Epilog to add figure labels (a) and (b). So we use GraphicsColumn instead, but in order to line up the frame correctly, we need to have equal padding on all sides (which is something I don't understand). Therefore we use
maxPadding[graphicsSequence__Graphics] := 1 + {
  Max /@ Transpose@(First /@ #)
  , Max /@ Transpose@(Last /@ #)
 } & @ (padding /@ List @ graphicsSequence)

ip = maxPadding[p1, p2]
(* {{36, 4}, {37, 1}} *)
and generate the figure using
GraphicsColumn[Show[#, ImagePadding -> ip] & /@ {p1, p2}
 , ImageSize -> 255
 , Frame -> True]
Export["fig2.pdf", Show[%, ImageSize -> 255]]
resulting in

Normally I would not include the Frame -> True, but I have included it here to show the extra white space to the left and right (and usually top and bottom) of the figures.
At this point, to get rid of the extra white space, I play around with the Inset parameters until I hit upon something that works. Here, I did:
GraphicsColumn[Show[#, ImagePadding -> ip] & /@ {p1, p2}
 , ImageSize -> 255
 , Spacings -> 17
 , Frame -> True
] /. {Inset[a__, size_] :> Inset[a, {1.12, 1.33} size]}
I found the scale factors 1.12 and 1.33 that modify the quantities in size by trial and error. In addition, I need to set the Spacings by hand, which introduces another bottleneck to workflow. Finally, I will need to modify these so that there actually is a little white-space to the left for the Epilog -> {Text["(a)", posA], Text["(b)", posB]}.
Despite these annoyances, the hack works. Below, I am showing an Exported Row of the Column solution and the hacked GraphicsColumn solution side-by-side. They are almost indistinguishable.

So, the question is, what have I done? I have very little idea how this works, and ideally there would be a solution that allows me to automate the process. (By the way, another option is to export the final figure with an image size larger than the column width and then clip the figure when I \includegraphics in the $\LaTeX$ document; this is obviously another non-ideal trial-and-error solution.)
Some extra poking around
Just to show that something strange (to me) is going on, below are some screen shots of the combined figures with the component figures selected. First, the Column solution with the second figure selected:

Second, the non-hacked GraphicsColumn solution with second figure selected:

You can see how the border of the selection is wider and taller (barely) in the second, even though both versions have the same left-right ImagePadding. (I have played around with this more, including making the ImagePadding the same around the entire figure for the Column solution; the same sorts of thing happen.) Third, the final side-by-side figure with the second figure in the GraphicColumn solution selected:

You can see how the border of the selection is now right up against the left and right sides of the figure.
Finally, just for fun, note that if we give the same padding to the figures only on the right and left, then GraphicsColumn doesn't even line up the frames correctly. Calling
GraphicsColumn[Show[#, ImagePadding -> ipLR] & /@ {p1, p2}, ImageSize -> 255]
results in

This is the final mystery, I guess. Thank you for slogging through this long tale.

Graphics[{Inset[...],Inset[...],...}]with appropriate options. See if this helps you: http://mathematica.stackexchange.com/a/79773/26956 (specifically, my functionundistortedGraphicsColumn, easily generalizable toGraphicsGridfunctionality). – LLlAMnYP Jul 15 '15 at 14:01GraphicsColumnand co. allocate equal space to every enclosedGraphics, whereasColumnstacks them as densely as possible. Additional conflict between e.g. the aspect ratio of the plots and the aspect ratio of the entireGraphicsColumncan cause further frustration (excessive white-space) – LLlAMnYP Jul 15 '15 at 14:08undistortedGraphicsColumnworks great, and your explanation in that post seems to identify the problem (I feel like I should've noticed thatGraphicsColumnlazily chooses theFrameAspectRatiorather than the fullGraphicsaspect ratio, for instance). My question is definitely a duplicate, then. I'm inclined to close it, then, but link to your posted solution so that all of this will be easily searchable, since it's such a common problem. – march Jul 15 '15 at 17:10