I have a list as
mylist={{0., 1.41421, 2.}, {0.01, 1.40715, 1.99}, {0.02, 1.40011,
  1.98}, {0.03, 1.39308, 1.97}, {0.04, 1.38607, 1.96}, {0.05, 1.37908,
   1.95}, {0.06, 1.37211, 1.94}, {0.07, 1.36516, 1.93}, {0.08,
  1.35823, 1.92}, {0.09, 1.35132, 1.91}, {0.1, 1.34443, 1.9}, {0.11,
  1.33755, 1.89}, {0.12, 1.33071, 1.88}, {0.13, 1.32388, 1.87}, {0.14,
   1.31707, 1.86}, {0.15, 1.31028, 1.85}, {0.16, 1.30352,
  1.84}, {0.17, 1.29678, 1.83}, {0.18, 1.29006, 1.82}, {0.19, 1.28337,
   1.81}, {0.2, 1.2767, 1.8}, {0.21, 1.27005, 1.79}, {0.22, 1.26343,
  1.78}, {0.23, 1.25683, 1.77}, {0.24, 1.25026, 1.76}, {0.25, 1.24371,
   1.75}, {0.26, 1.23719, 1.74}, {0.27, 1.2307, 1.73}, {0.28, 1.22423,
   1.72}, {0.29, 1.21779, 1.71}, {0.3, 1.21138, 1.7}, {0.31, 1.205,
  1.69}, {0.32, 1.19864, 1.68}, {0.33, 1.19231, 1.67}, {0.34, 1.18602,
   1.66}, {0.35, 1.17975, 1.65}, {0.36, 1.17351, 1.64}, {0.37,
  1.16731, 1.63}, {0.38, 1.16113, 1.62}, {0.39, 1.15499, 1.61}, {0.4,
  1.14888, 1.6}, {0.41, 1.1428, 1.59}, {0.42, 1.13676, 1.58}, {0.43,
  1.13075, 1.57}, {0.44, 1.12477, 1.56}, {0.45, 1.11883, 1.55}, {0.46,
   1.11293, 1.54}, {0.47, 1.10706, 1.53}, {0.48, 1.10123,
  1.52}, {0.49, 1.09543, 1.51}, {0.5, 1.08968, 1.5}, {0.51, 1.08396,
  1.49}, {0.52, 1.07828, 1.48}, {0.53, 1.07265, 1.47}, {0.54, 1.06705,
   1.46}, {0.55, 1.06149, 1.45}, {0.56, 1.05598, 1.44}, {0.57,
  1.05051, 1.43}, {0.58, 1.04508, 1.42}, {0.59, 1.03969, 1.41}, {0.6,
  1.03435, 1.4}, {0.61, 1.02905, 1.39}, {0.62, 1.0238, 1.38}, {0.63,
  1.0186, 1.37}, {0.64, 1.01345, 1.36}, {0.65, 1.00834, 1.35}, {0.66,
  1.00328, 1.34}, {0.67, 0.998269, 1.33}, {0.68, 0.99331,
  1.32}, {0.69, 0.988401, 1.31}, {0.7, 0.983545, 1.3}, {0.71,
  0.978741, 1.29}, {0.72, 0.97399, 1.28}, {0.73, 0.969293,
  1.27}, {0.74, 0.964651, 1.26}, {0.75, 0.960065, 1.25}, {0.76,
  0.955535, 1.24}, {0.77, 0.951063, 1.23}, {0.78, 0.946649,
  1.22}, {0.79, 0.942294, 1.21}, {0.8, 0.937998, 1.2}, {0.81,
  0.933763, 1.19}, {0.82, 0.929589, 1.18}, {0.83, 0.925478,
  1.17}, {0.84, 0.921429, 1.16}, {0.85, 0.917445, 1.15}, {0.86,
  0.913525, 1.14}, {0.87, 0.909671, 1.13}, {0.88, 0.905883,
  1.12}, {0.89, 0.902162, 1.11}, {0.9, 0.89851, 1.1}, {0.91, 0.894926,
   1.09}, {0.92, 0.891412, 1.08}, {0.93, 0.887969, 1.07}, {0.94,
  0.884597, 1.06}, {0.95, 0.881297, 1.05}, {0.96, 0.878071,
  1.04}, {0.97, 0.874918, 1.03}, {0.98, 0.871839, 1.02}, {0.99,
  0.868837, 1.01}, {1., 0.86591, 1.}, {1.01, 0.86306, 0.99}, {1.02,
  0.860288, 0.98}, {1.03, 0.857595, 0.97}, {1.04, 0.854981,
  0.96}, {1.05, 0.852447, 0.95}, {1.06, 0.849993, 0.94}, {1.07,
  0.847621, 0.93}, {1.08, 0.845331, 0.92}, {1.09, 0.843123,
  0.91}, {1.1, 0.840999, 0.9}, {1.11, 0.83896, 0.89}, {1.12, 0.837004,
   0.88}, {1.13, 0.835134, 0.87}, {1.14, 0.83335, 0.86}, {1.15,
  0.831652, 0.85}, {1.16, 0.830041, 0.84}, {1.17, 0.828517,
  0.83}, {1.18, 0.827082, 0.82}, {1.19, 0.825734, 0.81}, {1.2,
  0.824476, 0.8}, {1.21, 0.823306, 0.79}, {1.22, 0.822226,
  0.78}, {1.23, 0.821236, 0.77}, {1.24, 0.820337, 0.76}, {1.25,
  0.819527, 0.75}, {1.26, 0.818809, 0.74}, {1.27, 0.818182,
  0.73}, {1.28, 0.817645, 0.72}, {1.29, 0.817201, 0.71}, {1.3,
  0.816848, 0.7}, {1.31, 0.816586, 0.69}, {1.32, 0.816417,
  0.68}, {1.33, 0.816339, 0.67}, {1.34, 0.816353, 0.66}, {1.35,
  0.816459, 0.65}, {1.36, 0.816657, 0.64}, {1.37, 0.816946,
  0.63}, {1.38, 0.817327, 0.62}, {1.39, 0.8178, 0.61}, {1.4, 0.818364,
   0.6}, {1.41, 0.81902, 0.59}, {1.42, 0.819766, 0.58}, {1.43,
  0.820603, 0.57}, {1.44, 0.82153, 0.56}, {1.45, 0.822548,
  0.55}, {1.46, 0.823655, 0.54}, {1.47, 0.824852, 0.53}, {1.48,
  0.826138, 0.52}, {1.49, 0.827513, 0.51}, {1.5, 0.828975,
  0.5}, {1.51, 0.830526, 0.49}, {1.52, 0.832163, 0.48}, {1.53,
  0.833888, 0.47}, {1.54, 0.835699, 0.46}, {1.55, 0.837595,
  0.45}, {1.56, 0.839576, 0.44}, {1.57, 0.841642, 0.43}, {1.58,
  0.843791, 0.42}, {1.59, 0.846024, 0.41}, {1.6, 0.84834, 0.4}, {1.61,
   0.850737, 0.39}, {1.62, 0.853215, 0.38}, {1.63, 0.855774,
  0.37}, {1.64, 0.858413, 0.36}, {1.65, 0.86113, 0.35}, {1.66,
  0.863926, 0.34}, {1.67, 0.866799, 0.33}, {1.68, 0.869749,
  0.32}, {1.69, 0.872775, 0.31}, {1.7, 0.875877, 0.3}, {1.71,
  0.879052, 0.29}, {1.72, 0.882302, 0.28}, {1.73, 0.885624,
  0.27}, {1.74, 0.889017, 0.26}, {1.75, 0.892483, 0.25}, {1.76,
  0.896018, 0.24}, {1.77, 0.899623, 0.23}, {1.78, 0.903296,
  0.22}, {1.79, 0.907038, 0.21}, {1.8, 0.910846, 0.2}, {1.81, 0.91472,
   0.19}, {1.82, 0.91866, 0.18}, {1.83, 0.922664, 0.17}, {1.84,
  0.926732, 0.16}, {1.85, 0.930863, 0.15}, {1.86, 0.935055,
  0.14}, {1.87, 0.939309, 0.13}, {1.88, 0.943623, 0.12}, {1.89,
  0.947996, 0.11}, {1.9, 0.952428, 0.1}, {1.91, 0.956919,
  0.09}, {1.92, 0.961466, 0.08}, {1.93, 0.966069, 0.07}, {1.94,
  0.970728, 0.06}, {1.95, 0.975441, 0.05}, {1.96, 0.980208,
  0.04}, {1.97, 0.985028, 0.03}, {1.98, 0.989901, 0.02}, {1.99,
  0.994825, 0.01}, {2., 0.9998, 0.}};
I used of
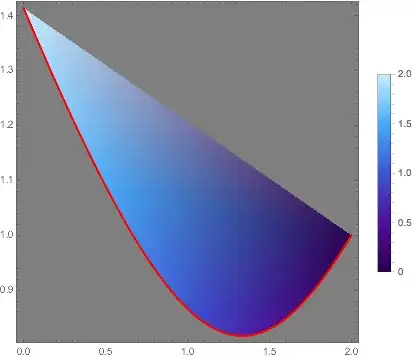
ListDensityPlot[mylist, ClippingStyle -> None,
   PlotLegends -> Automatic, ColorFunction -> "DeepSeaColors",
   ImageSize -> 200]
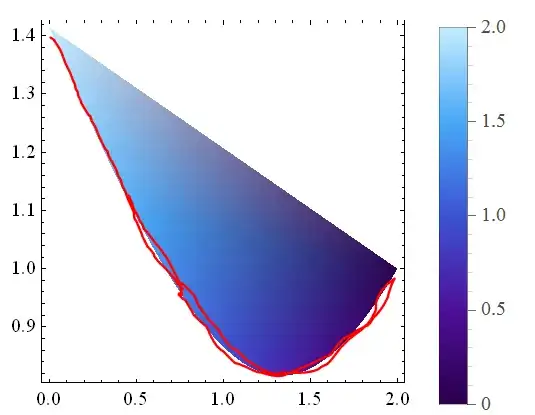
but the obtained plot is not my desire. Maybe it is because of incorrect selected plot command. My desire is a plot with the preferable boundary relative to its background. I drawn manually what I mean. Red line is the boundary which must be have a gradient color regard to its environment.
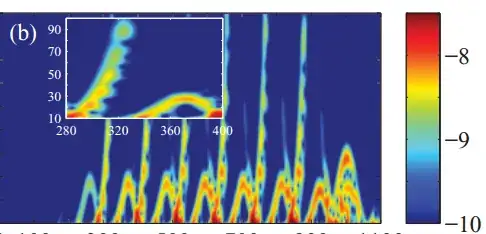
I bring another plot, which is not related to mylist, but it drawn with a list data. My desire is similar to this one: