14

Is it possible to create detached interactive plots in Mathematica like those in MATLAB, Jupyter (IPython), etc. rather than inline ones?

This is an interactive GIF from Rodeo IDE for Python as an example, click on it if it is not giffy. It is quite long animation.

example from Rodeo IDE

J. M.'s missing motivation
  • 124,525
  • 11
  • 401
  • 574
den.run.ai
  • 972
  • 5
  • 16

2 Answers2

24

If you are serious about using this extensively, consider making a function based on CreateDocument...

Here is one way to pursue Szabolcs's line of thought. What follows is a function based on CreateDocument[] that can be used in conjunction with the (now somewhat neglected) option DisplayFunction, which handles where the output of graphics functions should be shown.

First, the custom display function:

popup[gr_] := CreateDocument[gr, "CellInsertionPointCell" -> Cell[], 
                             ShowCellBracket -> False, WindowElements -> {}, 
                             WindowFrame -> "Generic", WindowSize -> All,
                             WindowTitle -> None, WindowToolbars -> {}]

(thanks to Oleksandr for "CellInsertionPointCell".)

Using it is now as simple as

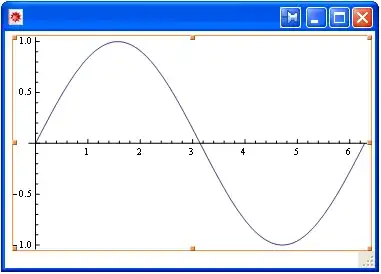
Plot[Sin[x], {x, 0, 2 π}, DisplayFunction -> popup]

which should yield a small window like this on Linux:

popup plot in Linux

or this on Windows (thanks to belisarius):

popup plot in Windows

or this on Mac OS X (thanks to Jens):

popup plot in Mac OS X

It will also work with 3D graphics, and will of course retain the interactivity.


A variation proposed by Szabolcs uses DocumentNotebook[] instead of CreateDocument[]:

popup[gr_] := DocumentNotebook[gr, "CellInsertionPointCell" -> Cell[], 
                               ShowCellBracket -> False, WindowElements -> {}, 
                               WindowFrame -> "Generic", WindowSize -> All,
                               WindowTitle -> None, WindowToolbars -> {}]

This produces a cell that is a mini-notebook of sorts, with a button that yields a popup version of the plot if pressed.

J. M.'s missing motivation
  • 124,525
  • 11
  • 401
  • 574
  • What interactivity do you mean? – den.run.ai Aug 28 '15 at 02:56
  • 2
    I mean, the 3D graphics in the popup can still be rotated, zoomed into, etc. – J. M.'s missing motivation Aug 28 '15 at 03:12
  • 2
    Here are some comments/suggestions: 1, WindowFrame -> "ThinFrame" has no title bar and its not closeable or movable on OS X. 2, 3D graphics can't easily be rotated without SphericalRegion -> True or RotationAction -> "Clip". 3, You could also set $DisplayFunction globally. (But non-plotting functions don't apply DisplayFunction without Show) 4, I really like DocumentNotebook instead of CreateDocument here because it doesn't pop out the window immediately but it does give a popout button. (@denfromufa) – Szabolcs Aug 28 '15 at 12:10
  • 1
    @Szabolcs. 1. I explicitly set WindowTitle -> None since I wasn't sure how to name the popup, and leaving it as "Untitled-n" seemed unseemly. What do you suggest as a replacement for WindowFrame -> "ThinFrame"? 2. I guess I can do special processing for Graphics3D[] arguments. 4. I'll try that alternate; however, if memory serves, MATLAB just pops out the plot at once, and I'd thought the OP would want something like it. – J. M.'s missing motivation Aug 28 '15 at 12:16
  • cool, but you need to have it appear behind all my other windows for a true matlab-like experience. ("ThinFrame" makes a window you cant get rid of on windows too, btw ) – george2079 Aug 28 '15 at 13:50
  • @george, hah, don't remember MATLAB doing that, but it's been ages since I used it... :) – J. M.'s missing motivation Aug 28 '15 at 13:52
  • @Sjoerd, I'd credit that to being well-versed with DisplayFunction gymnastics back in the days of old Mathematica. :) – J. M.'s missing motivation Aug 28 '15 at 14:09
  • 1
    Yeah, but we mostly did DisplayFunction->Identity and DisplayFunction->$DisplayFunction. – Sjoerd C. de Vries Aug 28 '15 at 14:19
  • @J. M. is away, I would like to ask how to apply this method to non-graphics object? I have a "plot" generated using Column[{Overlay[{plot11, plot1}], Overlay[{plot22, plot2}]}, Spacings -> 0]. But DisplayFunctionis an option for graphics and sound functions. I tried GraphicColumn. But because of the problem mentioned [here] (https://stackoverflow.com/a/5708788/4336241), I cannot get it done. Could you please give me some suggestion? Thanks. – Bemtevi77 Apr 28 '19 at 16:11
  • What about killing the last window that was created, or reploting it? If you run the function again it will open a new window instead of updating the last one. – A. Vieira Feb 12 '20 at 08:54
18

You can always create a new notebook and put things in it. If you are serious about using this extensively, consider making a function based on CreateDocument that sets the appropriate options for the notebook to look good.

Check what CreateDocument@Plot[Sin[x],{x,0,10}] does.

Or use a quick-and-dirty hack based on CreatePalette:

fig = CreatePalette[#, Background -> White, Saveable -> False] &

fig@MandelbrotSetPlot[]

You could also use PaletteNotebook instead of CreateDocument. This won't pop out the palette, it just adds a button to do it manually.

Szabolcs
  • 234,956
  • 30
  • 623
  • 1,263