25

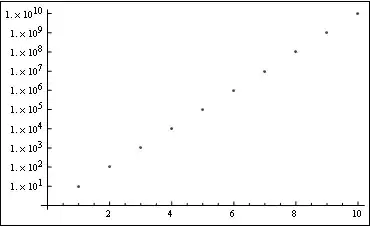
I want to express the ticks in scientific form. I tried two ways as following

ListLogPlot[Table[{x, 10^x}, {x, -1, 1}], Ticks -> {Automatic, {10^-1, 10^0, 10^1}}]

ListLogPlot[Table[{x, 10^x}, {x, -1, 1}],  
                          Ticks -> {Automatic, ScientificForm[{10^-1, 10^0, 10^1}]}]

enter image description here

but they just could not work as you can see; the latter even is wrong.

Why & how?

Edit by @belisarius

Scientific Notation is usually understood as ${1.\times 10^{-2}}$, however the OP wants just ${10^{-2}}$. Solutions for both cases can be found in the answers below.

Dr. belisarius
  • 115,881
  • 13
  • 203
  • 453
Mathieu
  • 467
  • 1
  • 4
  • 7
  • I believe this is a duplicate but as my vote is binding I shall hold it for the time being: http://mathematica.stackexchange.com/q/5369/121 – Mr.Wizard Aug 17 '12 at 19:22
  • @Mr.Wizard , thanks! I should ever find that link before; however i failed to use proper key words. Anyway, i think the command Superscript is the simplest way to fulfill my requirement. – Mathieu Aug 18 '12 at 16:59

3 Answers3

19

Here's one possibility. In this case, Superscript provides the needed format of exponents but Table helps in formatting Ticks over sets of values.

ListLogPlot[Table[PartitionsQ[n], {n, 50}], 
Ticks -> {Automatic, Table[{10^k, Superscript[10, k]}, {k, -2, 5}]},
PlotRange -> {Automatic, {1/1000, 10^5}}]

output

DavidC
  • 16,724
  • 1
  • 42
  • 94
  • 1
    So far i found the Superscript is the easiest way to realize the 10^n format, as long as one notice the code need to be the form: {position, label} as Verde also pointed out. Thank you for your answer! – Mathieu Aug 18 '12 at 17:06
  • Thanks. Sometimes a simple approach will do the job. – DavidC Aug 18 '12 at 17:30
  • I'd rather use ScientificForm: Ticks -> {Automatic, Table[{10^k, ScientificForm[10^k]}, {k, -2, 5}]}, in this case – Gabriel Sandoval May 29 '20 at 04:05
15

You need the second form for the ticks {position, label}.

As in

ListLogPlot[#, Ticks -> {Automatic, {#, ScientificForm@#} & /@ #}] &@Array[10.^# &, 10]

Mathematica graphics

Dr. belisarius
  • 115,881
  • 13
  • 203
  • 453
  • wow, ur code is very simple.It seems that the decimal point is crucial. If using Array[10^# &, 10], it goes back to ordinary form. Actually here i want the form like 10^1, 10^2,... without "1.". – Mathieu Aug 18 '12 at 05:18
14

I would suggest using the CustomTicks package. After loading the package, you do:

ListPlot[Table[{x, Log10[10^x]}, {x, -1, 1, .1}], Ticks -> {Automatic, LogTicks}]

Mathematica graphics

You can also specify to use CustomTicks's linear ticks:

ListPlot[Table[{x,Log10[10^x]},{x,-1,1,.1}],Ticks->{LinTicks,LogTicks}]

which gives a slightly different result:

Mathematica graphics

There are many options in this package to modify the ticks style, spacing, etc. See the complete user's guide.

Eli Lansey
  • 7,499
  • 3
  • 36
  • 73