A newbie here: I am trying to use ContourPlot to plot Intensity in a strongly focus laser beam. However this intensity is a function of not so trivial integrals, so it is taking very long to plot (actually waited for 30 minutes, then I gave it up). Is there any way to speed this up? I am most likely doing something the wrong way.
Here it is: 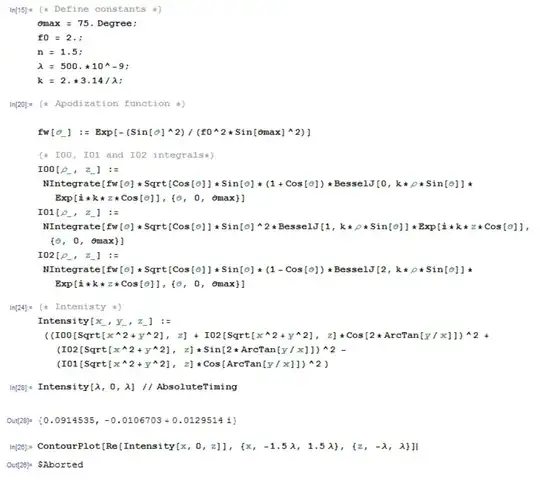
Code :
(* Define constants *)
θmax = 75. Degree;
f0 = 2.;
n = 1.5;
λ = 500.*10^-9;
k = 2.*3.14/λ;

fw[θ_] := Exp[-(Sin[θ]^2)/(f0^2*Sin[θmax]^2)]

I00[ρ_, z_] :=
 NIntegrate[
  fw[θ]*Sqrt[Cos[θ]]*Sin[θ]*(1 + Cos[θ])*
   BesselJ[0, k*ρ*Sin[θ]]*
   Exp[I*k*z*Cos[θ]], {θ, 0, θmax}]
I01[ρ_, z_] :=
 NIntegrate[
  fw[θ]*Sqrt[Cos[θ]]*Sin[θ]^2*
   BesselJ[1, k*ρ*Sin[θ]]*
   Exp[I*k*z*Cos[θ]], {θ, 0, θmax}]
I02[ρ_, z_] :=
 NIntegrate[
  fw[θ]*Sqrt[Cos[θ]]*Sin[θ]*(1 - Cos[θ])*
   BesselJ[2, k*ρ*Sin[θ]]*
   Exp[I*k*z*Cos[θ]], {θ, 0, θmax}]

 (* Intenisty *)
 Intensity[x_, y_, z_] := ((I00[Sqrt[x^2 + y^2], z] +
       I02[Sqrt[x^2 + y^2], z]*Cos[2*ArcTan[y/x]])^2 + (I02[
        Sqrt[x^2 + y^2], z]*
       Sin[2*ArcTan[y/x]])^2 - (I01[Sqrt[x^2 + y^2], z]*
       Cos[ArcTan[y/x]])^2 )

