21

I've been trying to put together a palette of useful functionality garnered from this site. There is useful stuff scattered all over the place, for example:

As an ugly, yet functional, way of putting them together, I have something like:

CreatePalette[Column[{
    OpenerView[{"Duplicate Active Notebook", duplicating}, True],
    OpenerView[{"Pasting a table", pasting}, True],
    OpenerView[{"Copy for StackExchange", copyForStackExchange}, True]
    (* etc *)
    }],
  WindowTitle -> "mathematica.stackexchange.com"];

where the definitions inside each OpenerView are slight modifications of the code from the above links. (Usually just stripping off any existing palette stuff is all that is required. I did find that a single button seemed to require ImageSize -> Automatic so it would display properly.)

So the question is, what else can I add to this?

Are there any procedures you use regularly that are suitable for a palette? Things that have made your mathematica experience easier and more productive?
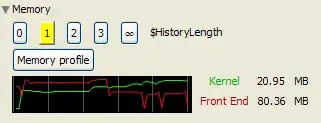
Is there any enlightening information that could be continually displayed on a palette? E.g. progress bars, memory usage, cursor position?
Are there any tips and hints for beginners that could be nicely presented on a palette?

wxffles
  • 14,246
  • 1
  • 43
  • 75

1 Answers1

19

I used to think that Mathematica was an incorrigible memory hog until I visited this site and discovered the wonders of $HistoryLength. This seems to be a common complaint that is easily remedied. Below is a scattering of buttons that show the current value and allow it to be easily changed:

historyLengthButtons := Grid[{Dynamic[Button[#, $HistoryLength = #, Background -> 
   If[$HistoryLength == #, Yellow, Automatic]]] & /@ {0, 1, 2, 3, Infinity}
 }, Spacings -> 1]

1

Edit

A memory usage graph:

memoryInUse = ConstantArray[MemoryInUse[], 60];
frontEndInUse = ConstantArray[MemoryInUse[$FrontEnd], 60];
RunScheduledTask[
  memoryInUse = Append[Rest@memoryInUse, MemoryInUse[]];
  frontEndInUse = Append[Rest@frontEndInUse, MemoryInUse[$FrontEnd]];
, 5];

memoryUsagePlot := Dynamic[Grid[{{Overlay[{
  ListPlot[memoryInUse, PlotRange -> All, Joined -> True, AspectRatio -> 1/5,
    Axes -> False, Background -> Black, PlotStyle -> Green, ImageSize -> Small,
    GridLines -> {12 (Range[6] - 1), None}, GridLinesStyle -> Darker@Gray],
  ListPlot[frontEndInUse, PlotRange -> All, Joined -> True, AspectRatio -> 1/5,
    Axes -> False, Background -> None, PlotStyle -> Red, ImageSize -> Small]
   }],
 Style["Kernel", Darker@Green], NumberForm[N[Last[memoryInUse]/10^6], {9, 2}], "MB"},
 {SpanFromAbove,
 Style["Front End", Darker@Red], NumberForm[N[Last[frontEndInUse]/10^6], {9, 2}], "MB"
 }}, Alignment -> {Center, Center}]]

As per Silvia's suggestion, a memory profile:

ClearAll[myByteCount]; 
myByteCount[symbolName_String] := 
  Quiet@Replace[ToHeldExpression[symbolName], 
  Hold[x__] :> If[MemberQ[Attributes[x], Protected | ReadProtected], 
  Sequence @@ {}, {ByteCount[Through[{OwnValues, DownValues, UpValues, SubValues, 
  DefaultValues, FormatValues, NValues}[Unevaluated@x, Sort -> False]]], symbolName}]];

memoryProfileButton := 
  Button["Memory profile", CreateDocument[
  Style[With[{listing = myByteCount /@ Names[]}, 
  Labeled[Grid[Reverse@Take[Sort[listing], -100], Frame -> True, Alignment -> Left], 
  Column[{Style["ByteCount for symbols without attributes Protected and" <>
  "ReadProtected in all contexts", 16, FontFamily -> "Times"], 
  Style[Row@{"Total: ", Total[listing[[All, 1]]], " bytes for ",
  Length[listing], " symbols"}, Bold]}, Center, 1.5], Top]],
  ShowStringCharacters -> False], WindowSelected -> True, 
  WindowTitle -> "Memory profile"], ImageSize -> Automatic]

Put it all in one section:

OpenerView[{"Memory", 
  Column[{historyLengthButtons, memoryProfileButton, memoryUsagePlot}]}, True]

memory

wxffles
  • 14,246
  • 1
  • 43
  • 75