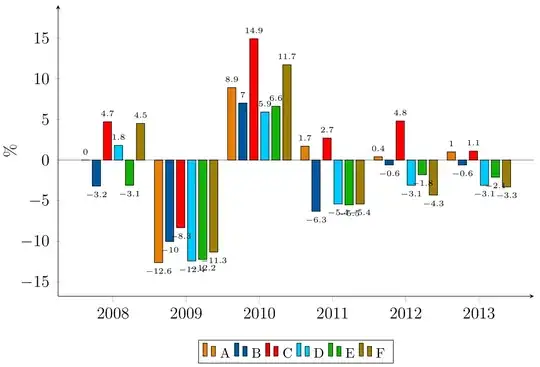
I have a problem with the placement and size of nodes in my barplot. I changed the size in the code from \small to \tiny:
every node near coord/.append style={font=\tiny}
but, the numbers are still larger than the barwidth and are overlapping with each other. I tried looking online for similar problems, but couldn't find any solution.
Is there any possibility to increase readability, by manual placment or change of size of the nodes?
Thanks for your help!
\documentclass[12pt]{book}
\usepackage{pgfplots}
\newlength\figureheight
\newlength\figurewidth
\begin{document}
\begin{figure}[H]
\centering
\definecolor{myblue}{HTML}{0058a2}
\definecolor{mygreen}{HTML}{13B508}
\definecolor{myred}{HTML}{FF0000}
\definecolor{myskyblue}{HTML}{00C9FF}
\definecolor{mybrown}{HTML}{9C7E05}
\definecolor{myorange}{HTML}{E87E05}
 \setlength\figureheight{9cm}
\setlength\figurewidth{\textwidth}
    \begin{tikzpicture}
\begin{axis}[
    axis lines=left,
color=black,
width=\figurewidth,
    height=\figureheight,
    bar width=6pt,
ybar,
enlargelimits=0.15,
legend style={at={(0.5,-0.15)},
  anchor=north,legend columns=-1},
ylabel={\%},
symbolic x coords={2008,2009,2010,2011,2012,2013},
xtick=data,
nodes near coords,
    every node near coord/.append style={font=\tiny},
nodes near coords align={vertical},
    nodes/.style={font=\footnotesize}
]

\begin{scope}[gray]
        \draw[gray] ({rel axis cs:1,0}|-{axis cs:2009,0}) -- ({rel axis cs:0,0}|-{axis cs:2009,0});
\end{scope}

\addplot[fill=myorange]
    coordinates{
    (2008,0)
    (2009,-12.6)
    (2010,8.9)
    (2011,1.7)
    (2012,0.4)
    (2013,1)
    };
  \addplot[fill=myblue]
    coordinates{
    (2008,-3.2)
    (2009,-10)
    (2010,7)
    (2011,-6.3)
    (2012,-0.6)
    (2013,-0.6)
    };
 \addplot[fill=myred]
    coordinates{
    (2008,4.7)
    (2009,-8.3)
    (2010,14.9)
    (2011,2.7)
    (2012,4.8)
    (2013,1.1)
    };
     \addplot[fill=myskyblue]
    coordinates{
    (2008,1.8)
    (2009,-12.4)
    (2010,5.9)
    (2011,-5.4)
    (2012,-3.1)
    (2013,-3.1)
    };
  \addplot[fill=mygreen]
    coordinates{
    (2008,-3.1)
    (2009,-12.2)
    (2010,6.6)
    (2011,-5.5)
    (2012,-1.8)
    (2013,-2.1)
    };
 \addplot[fill=mybrown]
    coordinates{
    (2008,4.5)
    (2009,-11.3)
    (2010,11.7)
    (2011,-5.4)
    (2012,-4.3)
    (2013,-3.3)
   };
\legend{A,B,C,D,E,F}
\end{axis}
\end{tikzpicture}
\end{figure}
\end{document}

widthof your axis, reduce the number ofsymbolic x coordsor rotate the x-ticks to something between now and 90 °. You can adapt this easily or search for it on this site. If you have a specialized question for this edits, you should clarify that in your question. – LaRiFaRi Oct 22 '14 at 13:13