I'm using tikz and wanting to recreate a diagram of this image:
I'm brand new to this. Would anybody be willing to give a helping hand?
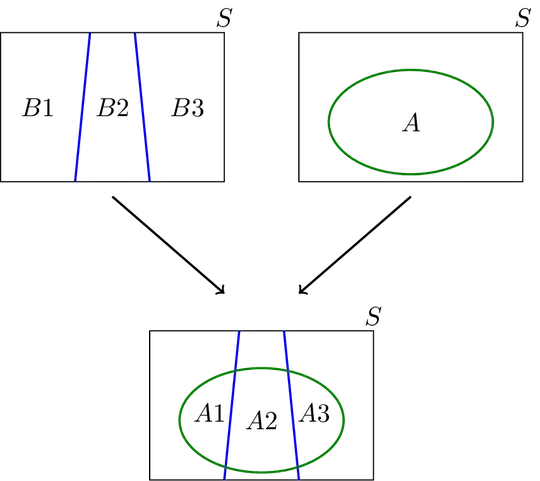
I'm using tikz and wanting to recreate a diagram of this image:
I'm brand new to this. Would anybody be willing to give a helping hand?
I would recommend to draw the rectangles as nodes. This is a start:
\documentclass{article}
\usepackage{tikz}
\usetikzlibrary{positioning, calc}

\begin{document}
\begin{tikzpicture}
\tikzset{
    myrectangle/.style={
        draw=black,
        minimum width=4cm,
        minimum height=2cm,
    },
    B/.style={
        draw=blue,
    },
    A/.style={
        draw=green,
    },
    >=stealth,
    node distance=1cm and 1cm,
}

    \node[myrectangle] (left) {};
    \node[myrectangle] (right) [right=of left] {};
    \path (left.south east) -- coordinate (tmp) (right.south west);
    \node[myrectangle] (bottom) [below=of tmp] {};

    % "contents" of left node
    \path (left.west) -- node[pos=.25] {B1} (left.east);
    \path (left.west) -- node[pos=.5] {B2} (left.east);
    \path (left.west) -- node[pos=.75] {B3} (left.east);

    \draw[B] ($(left.north west) ! .4 ! (left.north east)$) -- ($(left.south west) ! .35 ! (left.south east)$);
    \draw[B] ($(left.north west) ! .6 ! (left.north east)$) -- ($(left.south west) ! .66 ! (left.south east)$);

    % "contents" of right node
    \draw[A] (right.center) ellipse [x radius=1cm, y radius=.5cm] node {A};

    % "contents" of bottom node
    \path (bottom.west) -- node[pos=.25] {A1} (bottom.east);
    \path (bottom.west) -- node[pos=.5] {A2} (bottom.east);
    \path (bottom.west) -- node[pos=.75] {A3} (bottom.east);

    \draw[B] ($(bottom.north west) ! .4 ! (bottom.north east)$) -- ($(bottom.south west) ! .35 ! (bottom.south east)$);
    \draw[B] ($(bottom.north west) ! .6 ! (bottom.north east)$) -- ($(bottom.south west) ! .66 ! (bottom.south east)$);

    \draw[A] (bottom.center) ellipse [x radius=1cm, y radius=.5cm];

    % arrows
    \begin{scope}[
        shorten >=.2cm,
        shorten <=.2cm,
    ]
        \draw[->, black] (left) -- (bottom);
        \draw[->, black] (right) -- (bottom);
    \end{scope}

    % labels on top
    \node at (left.north east) [anchor=south east] {S};
    \node at (right.north east) [anchor=south east] {S};
    \node at (bottom.north east) [anchor=south east] {S};

\end{tikzpicture}
\end{document}

\draw (x1,y1) rectangle (x2,y2);draws a rectangle with these coordinates as (opposite) corners,\draw[green] (xc,yc) ellipse (2cm and 3cm);draws the ellipse,\draw (x1,y1)--(x2,y2);draws a line and\draw[->](x1,y1)--(x2,y2);draws an arrow from x1,y1 to x2,y2... Last:\node at (x1,y1) {$A_1$};writes math $A_1$ at the specific point. These are all you need to put in a tikzpicture environment and create the above figure (I suppose you have some math knowledge to select the coordinates). It would be nice from you to add the code as an answer after creating it yourself. – koleygr Sep 19 '17 at 17:02