I don't know if I have well understood the problem ???
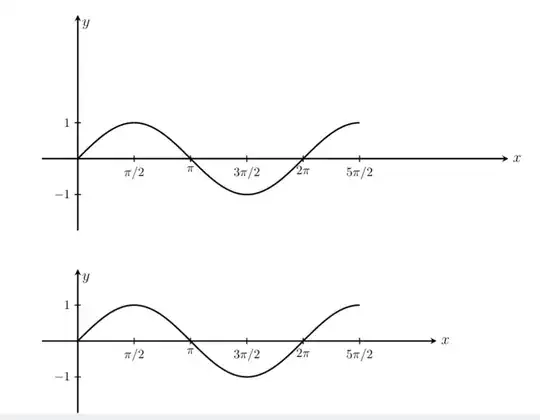
Try not using the width option but the xandy options which set the x an y unit vector.
\documentclass[10pt,a4paper]{article}
\usepackage{pgfplots}
\pgfplotsset{compat=1.15}
\begin{document}
\begin{tikzpicture}
\begin{axis}[
    %width=6cm,
    grid style={dashed, gray!30},
    axis lines=middle,
    axis on top,
    axis line style={-stealth,very thick},
    %
    xlabel={\large $x$}, xlabel style={anchor=west},
    ylabel={\large $y$}, ylabel style={align=right},
    tick style={black, thick,major tick length=5pt},
    %
    xmin=-1,  xmax=12,
    ymin=-2,  ymax=4,
    x=1cm,
    y=1cm,
    %
    x tick label style={below},
    y tick label style={left},
    %
    xtick={1.57,3.14,4.71,6.28,7.85},
    %xtick distance=pi/2,
    xticklabels={$\pi/2$,$\pi$,$3\pi/2$,$2\pi$,$5\pi/2$},
    %
    ytick={-1,1},
    yticklabels={$-1$,$1$},
    %
    after end axis/.code={
    \path(axis cs:0,0)
    node [anchor=north west,yshift=0 cm,
    xshift=0 cm] {}
    node [anchor=south east,xshift=0 cm] {};}]
    %
\addplot[domain=0:5*pi/2,smooth,samples=99,very thick]  {sin(deg(x))};
\end{axis}
\end{tikzpicture}
\vspace{1.5cm}
\begin{tikzpicture}
\begin{axis}[
    %width=6cm,
    grid style={dashed, gray!30},
    axis lines=middle,
    axis on top,
    axis line style={-stealth,very thick},
    %
    xlabel={\large $x$}, xlabel style={anchor=west},
    ylabel={\large $y$}, ylabel style={align=right},
    tick style={black, thick,major tick length=5pt},
    %
    xmin=-1,  xmax=10,
    ymin=-2,  ymax=2,
    x=1cm,
    y=1cm,
    %
    x tick label style={below},
    y tick label style={left},
    %
    xtick={1.57,3.14,4.71,6.28,7.85},
    %xtick distance=pi/2,
    xticklabels={$\pi/2$,$\pi$,$3\pi/2$,$2\pi$,$5\pi/2$},
    %
    ytick={-1,1},
    yticklabels={$-1$,$1$},
    %
    after end axis/.code={
    \path(axis cs:0,0)
    node [anchor=north west,yshift=0 cm,
    xshift=0 cm] {}
    node [anchor=south east,xshift=0 cm] {};}]
    %
\addplot[domain=0:5*pi/2,smooth,samples=99,very thick]  {sin(deg(x))};
\end{axis}
\end{tikzpicture}
\end{document}


xtick={...}. – John Kormylo Sep 05 '21 at 15:28