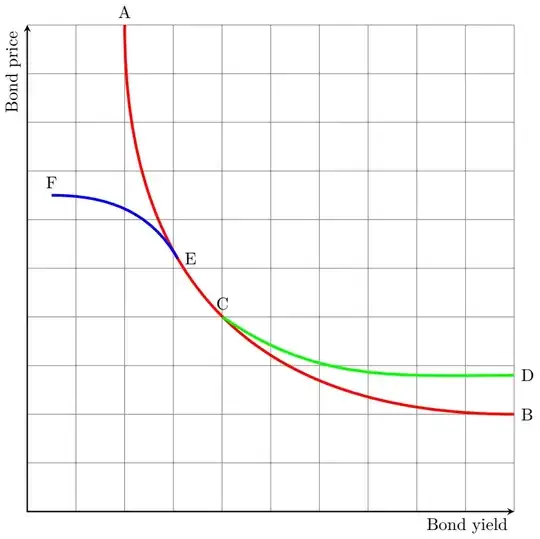
The general problem using nodes like you do it, that they containg inner spacing, so it is often advisable to use coordinates which are just points. For the rest it is bascially just using the to sytnax with entrance and exit angles in and out. I also used intersections to ensure E and C are on the line from A to B, but that is just a detail and can be achieved manually as well.
\documentclass{standalone}
\usepackage{tikz}
\usetikzlibrary{calc,intersections}
\begin{document}
    \begin{tikzpicture}[>=stealth,every node/.style={text=black}]
        \draw[step=1.0,gray,thin] (0,0) grid (10,10);
        \coordinate (D) at (10,2.8);
        \coordinate (F) at (0.5,6.5);
    \draw[red,ultra thick,looseness=1.2,name path=redline] (2,10) node[anchor=south] (A) {A} to[out=270,in=180] (10,2) node[anchor=west] (B){B};
    \path[name path=helpE] (0,5.2) -- ++(10,0);
    \path[name path=helpC] (0,4) -- ++(10,0);
    \path [name intersections={of=redline and helpE,by=E}];
    \path [name intersections={of=redline and helpC,by=C}];

    \draw[green,ultra thick] (C) node[anchor=south]{C} to[out=325,in=180] (D) node[anchor=west]{D};
    \draw[blue,ultra thick] (F) node[anchor=south]{F} to[out=0,in=120] (E) node[anchor=west] {E};

    \draw [<->,thick] (0,10) node (yaxis) [anchor=south east,rotate=90] {Bond price}
    |- (10,0) node (xaxis) [anchor=north east] {Bond yield};
\end{tikzpicture}

\end{document}
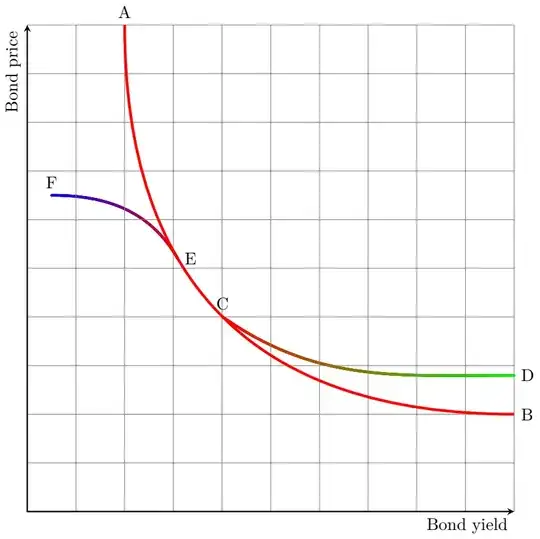
EDIT: You can of course combine this approach with the colour gradient question you linked to. I take no credit, this is simply copy-paste and apply:
\documentclass{standalone}
\usepackage{tikz}
\usetikzlibrary{calc,intersections,decorations.markings}
\pgfdeclarelayer{background}
\pgfsetlayers{background, main}
\tikzset{test/.style n args={3}{
        postaction={
            decorate,
            decoration={
                markings,
                mark=between positions 0 and \pgfdecoratedpathlength step 0.4pt with {
                    \pgfmathsetmacro\myval{multiply(
                        divide(
                        \pgfkeysvalueof{/pgf/decoration/mark info/distance from start}, \pgfdecoratedpathlength
                        ),
                        100
                        )};
                    \pgfsetfillcolor{#3!\myval!#2};
                    \pgfpathcircle{\pgfpointorigin}{#1};
                    \pgfusepath{fill};}
}}}}
\begin{document}
    \begin{tikzpicture}[>=stealth,every node/.style={text=black}]
        \draw[step=1.0,gray,thin] (0,0) grid (10,10);
        \coordinate (D) at (10,2.8);
        \coordinate (F) at (0.5,6.5);
    \draw[red,ultra thick,looseness=1.2,name path=redline] (2,10) node[anchor=south] (A) {A} to[out=270,in=180] (10,2) node[anchor=west] (B){B};

    \begin{pgfonlayer}{background}
        \path[name path=helpE] (0,5.2) -- ++(10,0);
        \path[name path=helpC] (0,4) -- ++(10,0);
        \path [name intersections={of=redline and helpE,by=E}];
        \path [name intersections={of=redline and helpC,by=C}];

        \draw[test={0.8pt}{red}{green},ultra thick] (C) node[anchor=south]{C} to[out=325,in=180] (D) node[anchor=west]{D};
        \draw[test={0.8pt}{blue}{red},,ultra thick] (F) node[anchor=south]{F} to[out=0,in=120] (E) node[anchor=west] {E};
    \end{pgfonlayer}

    \draw [<->,thick] (0,10) node (yaxis) [anchor=south east,rotate=90] {Bond price}
    |- (10,0) node (xaxis) [anchor=north east] {Bond yield};
\end{tikzpicture}

\end{document}
And just because I think it makes more sense to put the branches behind the main line, I added some layers.