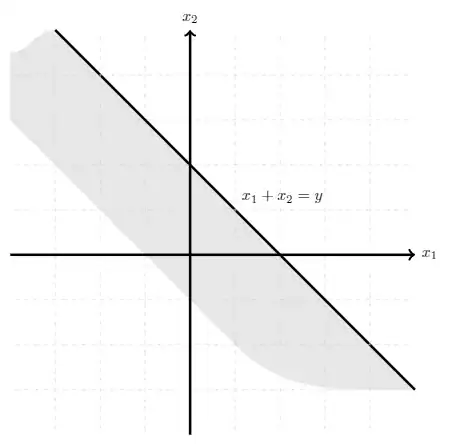
Maybe something like this? I am not sure how the grey area should be drawn.
\documentclass[tikz,border=2mm]{standalone}
\begin{document}
\begin{tikzpicture}
\fill[black!10] (-4,4.5) to[out=0,in=180] (-3,5) -- (5,-3) to[out=180,in=-45] (1,-2) -- (-4,3) -- cycle;
\draw[ultra thick] (-3,5) -- (5,-3) node[above right, midway]{$x_1 + x_2 = y$};
\draw[help lines, color=gray!30, dashed] (-3.9,-3.9) grid (4.9,4.9);
\draw[->, ultra thick] (-4,0) -- (5,0) node[right]{$x_1$};
\draw[->, ultra thick] (0,-4) -- (0,5) node[above]{$x_2$};
\end{tikzpicture}
\end{document}
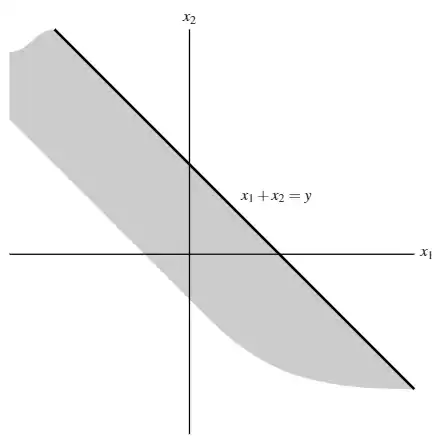
Or even more like the original:
\documentclass[tikz,border=2mm]{standalone}
\usepackage{mathptmx}
\begin{document}
\begin{tikzpicture}
\fill[black!20] (-4,4.5) to[out=0,in=180] (-3,5) -- (5,-3) to[out=180,in=-45] (.5,-1.5) -- (-4,3) -- cycle;
\draw[ultra thick] (-3,5) -- (5,-3) node[above right, midway]{$x_1 + x_2 = y$};
\draw[thick] (-4,0) -- (5,0) node[right]{$x_1$};
\draw[thick] (0,-4) -- (0,5) node[above]{$x_2$};
\end{tikzpicture}
\end{document}
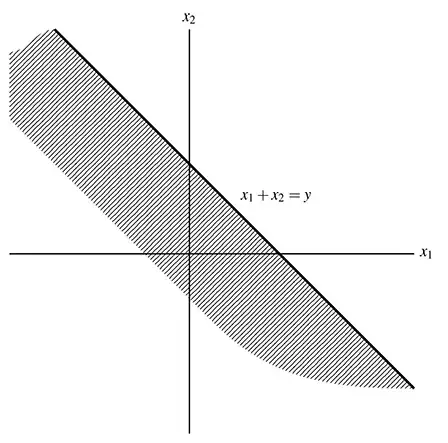
If you would like to fill the area with a pattern, I would recommend the patterns library of TikZ that needs to be loaded in the preamble of your document (after having loaded the tikz package). Please consult chapter 62 of the TikZ/PGF documentation regarding the different options.
\documentclass[tikz,border=2mm]{standalone}
\usepackage{mathptmx}
\usetikzlibrary{patterns}
\begin{document}
\begin{tikzpicture}
\fill[pattern=north east lines] (-4,4.5) to[out=0,in=180] (-3,5) -- (5,-3) to[out=180,in=-45] (.5,-1.5) -- (-4,3) -- cycle;
\draw[ultra thick] (-3,5) -- (5,-3) node[above right, midway]{$x_1 + x_2 = y$};
\draw[thick] (-4,0) -- (5,0) node[right]{$x_1$};
\draw[thick] (0,-4) -- (0,5) node[above]{$x_2$};
\end{tikzpicture}
\end{document}