UPDATED
This solution is based on the pgfplotstable package. A wide table is typeset using several blocks.
The width of each block and its quantity is calculated automatically.
No additional user parameters are required, except for the data format.
First, the raw data, without the header and the first column, is stored in a macro.
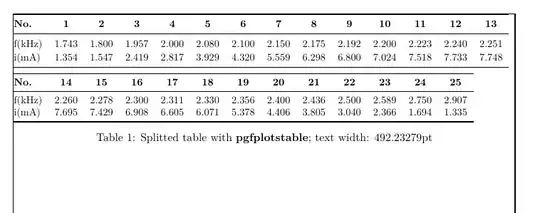
The numbered header is generated automatically and then the table is composed with the blocks, each with the first column embedded and with a number of columns to fit the width of the text.
All blocks are tables themselves, but only the last one will receive the caption.
The first example shows two blocks of 13 + 12 columns of data.
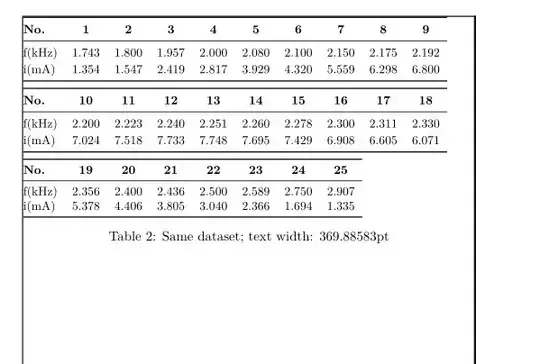
The second example, using the same data, but with a reduced text width, resulting in three blocks of 9 + 9 + 7 columns, shows the automatic rearrangement.
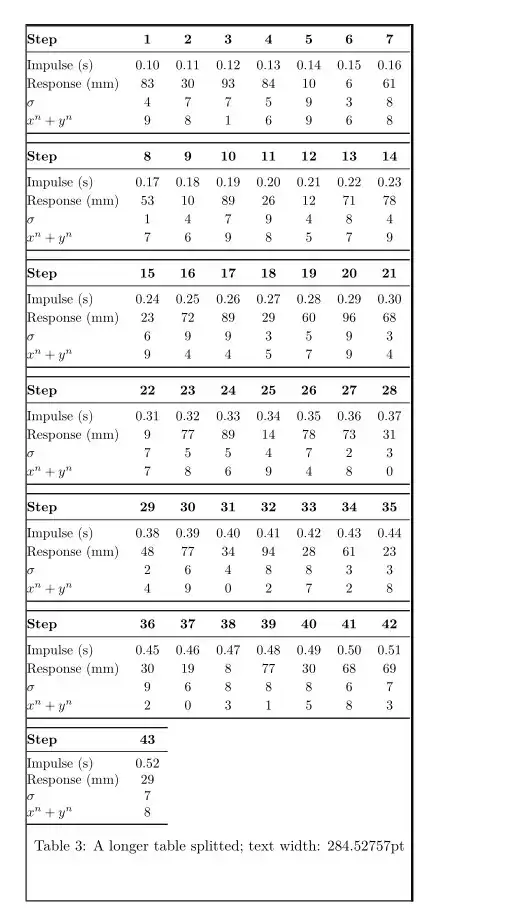
The third example uses a larger dataset with a header + 4 rows.
(I) A wide table splitted in two blocks.
(II) The same data in a narrower page (using \newgeometry{...})
(III) A larger data set: 43 columns and 4 rows
USAGE
(1) Load the dataset and assign it to a macro. The data can be used immediately or in another part of the document: \pgfplotstableread {<raw data>} {<macro name of the data>}
(2) Load the header and the first column labels using
\renewcommand{\HeaderLabel}{<formated text>}
\renewcommand{\FirstRowLabel}{<formated text>}, etc.
Up to four rows are implemented for this example. Adding more rows is trivial.
Note that only the row names with used rows are typeset. The others are truncated from the list.
(3) Define the template for the longest label and the widest data column. They are necessary to calculate the size of the blocks.
(4) Typeset the table using
\FormatData{{<macro name of the data>}{<caption text>}
Table 1 was created using
\pgfplotstableread{% store table in macro \DataSeti
1.743 & 1.800 & 1.957 & 2.000 & 2.080 & 2.100 & 2.150 & 2.175 & 2.192 & 2.200 & 2.223 & 2.240 & 2.251 & 2.260 & 2.278 & 2.300 & 2.311 & 2.330 & 2.356 & 2.400 & 2.436 & 2.500 & 2.589 & 2.750 & 2.907 \\
1.354 & 1.547 & 2.419 & 2.817 & 3.929 & 4.320 & 5.559 & 6.298 & 6.800 & 7.024 & 7.518 & 7.733 & 7.748 &7.695 & 7.429 & 6.908 & 6.605 & 6.071 & 5.378 & 4.406 & 3.805 & 3.040 & 2.366 & 1.694 & 1.335 \\
}{\DataSeti}
%%**************INITIAL SETUP BY USER of \DataSeti
\renewcommand{\HeaderLabel}{\small No.} % header label will be displayed in bold
\renewcommand{\FirstRowLabel}{\small f(kHz)} % first row label
\renewcommand{\SecondRowLabel}{\small i(mA)} % second row label
\renewcommand{\LongestNumber}{\small 0.000} % <<<< needed to calculate columns width
\renewcommand{\LongestLabel}{\small f(kHz)} % <<<< needed to calculate first column width
%%**************END INITIAL SETUP BY USER
\FormatData{\DataSeti}{Splitted table with \textbf{pgfplotstable}; text width: \the\textwidth}
This is the complete code
\documentclass[11pt,a4paper]{report}
\usepackage[left=2.0cm, right=1.7cm, top=4.0cm, bottom=3.0cm, marginparwidth=0pt, marginparsep=0pt]{geometry}
\usepackage{pgfplotstable}
\pgfplotsset{compat=1.18}
\pgfplotstableset{col sep =&, row sep =\}
\usepackage{forloop}
\usepackage{ifthen}
\usepackage{booktabs}
\parskip=0pt
\usepackage{showframe}% only to show margins
%**************DEFAULT SETUP TO BE MODIFIED LATER BY USER
\newcommand{\HeaderLabel}{\small xx} % header label will be displayed in bold
\newcommand{\FirstRowLabel}{\small WXYZ} % first row label
\newcommand{\SecondRowLabel}{\small abc} % second row label
\newcommand{\ThirdRowLabel}{\small def} % third row label
\newcommand{\FourhRowLabel}{\small ghk} % fourth row label
\newcommand{\LongestNumber}{\small 0.000} % <<<< needed to calculate columns width
\newcommand{\LongestLabel}{\small WXYZ} % <<<< needed to calculate the first column width
%**************END INITIAL SETUP BY USER
%***************** INIT
\arrayrulewidth=0pt
\newlength{\colwidth}
\newlength{\firstcolwidth}
\newcommand{\MaxCol}{0}
\newcommand{\MaxColi}{0}
\newcommand{\MaxColii}{1}
\newcommand{\Mshifth}{0}
\settowidth{\colwidth}{\LongestNumber}
\settowidth{\firstcolwidth}{\LongestLabel}
\newcounter{ct}
\newcounter{ctx}
%***************** END INIT
\newcommand{\ResetNumbers}{% reset
\renewcommand{\MaxCol}{0}
\renewcommand{\MaxColi}{0}
\renewcommand{\MaxColii}{1}
\renewcommand{\Mshifth}{0}
}
\newcommand{\MakeNumbers}[1]{% blocks structure
\pgfplotstablegetcolsof{#1}
\pgfmathtruncatemacro{\finex}{\pgfmathresult}
\pgfmathint{(\textwidth-\firstcolwidth-\tabcolsep) / (\colwidth+2\tabcolsep) -1 }
\renewcommand{\MaxCol}{\pgfmathresult} % number of columns -1 to display <<<<<<<<<<<<<<<<<
\pgfmathtruncatemacro{\MaxColi}{\MaxColi+\Mshifth}
\pgfmathtruncatemacro{\MaxColii}{\MaxColi+1}
\pgfmathtruncatemacro{\MaxLast}{\MaxColi+\MaxCol}
\pgfmathtruncatemacro{\MaxRemain}{\finex-\MaxLast}
\pgfmathtruncatemacro{\MaxLastLess}{\MaxRemain+\MaxCol+ \MaxColi-1}
\pgfmathtruncatemacro{\Mshifth}{\MaxCol+1}
\pgfmathtruncatemacro{\NBlocks}{(\finex+2) / (\MaxCol+1) + 2}
}
\newcommand{\MakeBlock}[2]{% produce one block
\MakeNumbers{#1}
\begin{table}[ht!]
\ifthenelse{\MaxRemain >0}
{\pgfplotstabletypeset[columns={z,\MaxColi,\MaxColii,...,\MaxLast}]{#1} \vspace{-4ex}}{}
\ifthenelse{\MaxRemain < 0}% last block
{%
\ifthenelse{\MaxRemain < -\MaxCol}{}
{%
\ifthenelse{\MaxLastLess > \MaxColii}
{\pgfplotstabletypeset[font=\small,columns={z,\MaxColi,\MaxColii,...,\MaxLastLess}]{#1} \caption{#2}}
{\pgfplotstabletypeset[font=\small,columns={z,\MaxLastLess},]{#1} \caption{#2}}
}
}
\ifthenelse{\MaxRemain = 0}
{\pgfplotstabletypeset[font=\small,columns={z,\MaxColi,\MaxColii,...,\MaxLastLess}]{#1} \caption{#2}}{}
\end{table*}
}
\newcommand{\FormatData}[2]{% typeset all blocks => final table #1 macro of dataset, #2 caption
\pgfplotstablegetcolsof{#1}
\pgfmathtruncatemacro{\finex}{\pgfmathresult}
\pgfmathsetmacro{\fine}{\pgfmathresult-1}
\pgfplotsinvokeforeach{0,1,...,\fine} {% numbered header
\pgfplotstableset{
columns/##1/.style = {column name=\pgfmathparse{int(##1+1)}\textbf{\pgfmathresult}},
}}%
\pgfplotstableset{%
create on use/z/.style={create col/set list={\FirstRowLabel,\SecondRowLabel,\ThirdRowLabel,\FourhRowLabel}},
string type,
header=false,
columns/z/.style={column name={\textbf{\HeaderLabel}}, column type=@{}{l}},
every head row/.style={before row=\toprule,
after row=\midrule,
},
every last row/.style={after row=\bottomrule},
column type={>{\small\centering\arraybackslash}c},
}
\setcounter{ctx}{10} % max default
\forloop{ct}{1}{\value{ct} < \thectx}{\MakeBlock{#1}{#2}}
\ResetNumbers
} % end tableset
\begin{document}
\pgfplotstableread{% store table in macro \DataSeti
1.743 & 1.800 & 1.957 & 2.000 & 2.080 & 2.100 & 2.150 & 2.175 & 2.192 & 2.200 & 2.223 & 2.240 & 2.251 & 2.260 & 2.278 & 2.300 & 2.311 & 2.330 & 2.356 & 2.400 & 2.436 & 2.500 & 2.589 & 2.750 & 2.907 \
1.354 & 1.547 & 2.419 & 2.817 & 3.929 & 4.320 & 5.559 & 6.298 & 6.800 & 7.024 & 7.518 & 7.733 & 7.748 &7.695 & 7.429 & 6.908 & 6.605 & 6.071 & 5.378 & 4.406 & 3.805 & 3.040 & 2.366 & 1.694 & 1.335 \
}{\DataSeti}
%%**************INITIAL SETUP BY USER of \DataSeti
\renewcommand{\HeaderLabel}{\small No.} % header label will be displayed in bold
\renewcommand{\FirstRowLabel}{\small f(kHz)} % first row label
\renewcommand{\SecondRowLabel}{\small i(mA)} % second row label
\renewcommand{\LongestNumber}{\small 0.000} % <<<< needed to calculate columns width
\renewcommand{\LongestLabel}{\small f(kHz)} % <<<< needed to calculate first column width
%%**************END INITIAL SETUP BY USER
\FormatData{\DataSeti}{Splitted table with \textbf{pgfplotstable}; text width: \the\textwidth}
\clearpage
\newgeometry{left=3.0cm, right=5.0cm, top=3.0cm, bottom=3.0cm, marginparwidth=0pt, marginparsep=0pt}
% There is not need to reload nor setup the table again
\FormatData{\DataSeti}{Same dataset; text width: \the\textwidth}
\clearpage
\newgeometry{left=3.0cm, right=8.0cm, top=4.0cm, bottom=3.0cm, marginparwidth=0pt, marginparsep=0pt}
\pgfplotstableread{% store table in macro \DataSetii
0.10 &0.11 &0.12 &0.13 &0.14 &0.15 &0.16 &0.17 &0.18 &0.19 &0.20 &0.21 &0.22 &0.23 &0.24 &0.25 &0.26 &0.27 &0.28 &0.29 &0.30 &0.31 &0.32 &0.33 &0.34 &0.35 &0.36 &0.37 &0.38 &0.39 &0.40 &0.41 &0.42 &0.43 &0.44 &0.45 &0.46 &0.47 &0.48 &0.49 &0.50 &0.51 &0.52\
83 &30 &93 &84 &10 &6 &61 &53 &10 &89 &26 &12 &71 &78 &23 &72 &89 &29 &60 &96 &68 &9 &77 &89 &14 &78 &73 &31 &48 &77 &34 &94 &28 &61 &23 &30 &19 &8 &77 &30 &68 &69 &29\
4 &7 &7 &5 &9 &3 &8 &1 &4 &7 &9 &4 &8 &4 &6 &9 &9 &3 &5 &9 &3 &7 &5 &5 &4 &7 &2 &3 &2 &6 &4 &8 &8 &3 &3 &9 &6 &8 &8 &8 &6 &7 &7\
9 &8 &1 &6 &9 &6 &8 &7 &6 &9 &8 &5 &7 &9 &9 &4 &4 &5 &7 &9 &4 &7 &8 &6 &9 &4 &8 &0 &4 &9 &0 &2 &7 &2 &8 &2 &0 &3 &1 &5 &8 &3 &8\
}{\DataSetii}
%%**************INITIAL SETUP BY USER \DataSetii
\renewcommand{\HeaderLabel}{\small Step} % header label will be displayed in bold
\renewcommand{\FirstRowLabel}{\small Impulse (s) } % first row label
\renewcommand{\SecondRowLabel}{\small Response (mm)} % second row label
\renewcommand{\ThirdRowLabel}{$\sigma$} % third row label
\renewcommand{\FourhRowLabel}{$x^n + y^n$} % fourth row label
\renewcommand{\LongestNumber}{\small 0.00} % <<<< needed to calculate columns width
\renewcommand{\LongestLabel}{\small Response (mm)} % <<<< needed to calculate first column width
%%**************END INITIAL SETUP BY USER
\FormatData{\DataSetii}{A longer table splitted; text width: \the\textwidth}
\end{document}


