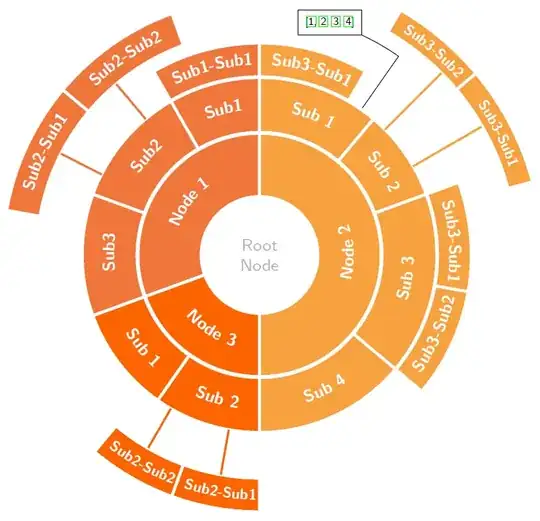
You could just add a custom node by inserthing this piece of code at the end of the contents of the tikzpicture environment (and delete or comment out the other node which is replaced by this code):
\draw[black] (55:85pt) -- (55:115pt) arc (55:65:115pt)
 node[draw, anchor=south east] {\tiny\cite{einstein,dirac,knuth-fa,knuthwebsite}};
Maybe it is possible to use the \arcarrow macro defined in this code to draw the connecting line, but I did not fully understand how it is supposed to work (mainly because I didn't take the time to sufficiently study it), so I just ignored it.
Full code (taken from the linked question):
\documentclass{article}
\usepackage[utf8]{inputenc}
\title{Sunburst with References}
\date{}
%%% IMPORT
\usepackage{hyperref}       % hyperlinks
\usepackage{url}            % simple URL typesetting
\usepackage{graphicx}
\usepackage{xcolor}
\definecolor{orange1}{HTML}{F1753A}
\definecolor{orange2}{HTML}{F7A13E}
\definecolor{orange3}{HTML}{FC6300}
\definecolor{root}{HTML}{B2B2B2}
\usepackage{tikz}
\usepackage{pgfmath}
\usetikzlibrary{decorations.text, arrows.meta,calc,shadows.blur,shadings}
\renewcommand*\familydefault{\sfdefault} % Set font to serif family
% arctext from Andrew code with modifications:
%Variables: 1: ID, 2:Style 3:box height 4: Radious 5:start-angl 6:end-angl 7:text {format along path}
\def\arctext[#1][#2]#3(#5)(#6)#7{
\draw[
    color=white,
    thick,
    line width=1.3pt,
    fill=#2
]
(#5:#4cm+#3) coordinate (above #1) arc (#5:#6:#4cm+#3)
-- (#6:#4) coordinate (right #1) -- (#6:#4cm-#3) coordinate (below right #1)
arc (#6:#5:#4cm-#3) coordinate (below #1)
-- (#5:#4) coordinate (left #1) -- cycle;
\def\a#1{#4cm+#3}
\def\b#1{#4cm-#3}
\path[
    decoration={
        raise = -0.5ex, % Controls relavite text height position.
        text  along path,
        text = {#7},
        text align = center,

    },
    decorate
    ]
    (#5:#4) arc (#5:#6:#4);
}
\def\arcbase[#1][#2]#3(#5)(#6)#7{
\draw[
    color=#2,
    thin,
    line width=1.3pt,
    % fill=black
]
(#5:#4cm+#3) coordinate (above #1) arc (#5:#6:#4cm+#3)
-- (#6:#4) coordinate (right #1) -- (#6:#4cm-#3) coordinate (below right #1)
arc (#6:#5:#4cm-#3) coordinate (below #1)
-- (#5:#4) coordinate (left #1) -- cycle;
\def\a#1{#4cm+#3}
\def\b#1{#4cm-#3}
\path[
    decoration={
        raise = -0.5ex, % Controls relavite text height position.
        text  along path,
        text = {#7},
        text align = center,

    },
    decorate
    ]
    (#5:#4) arc (#5:#6:#4);
}
%arcarrow, this is mine, for beerware purpose...
%Function: Draw an arrow from arctex coordinate specific nodes to another
%Arrow start at the start of arctext box and could be shifted to change the position
%to avoid go over another box.
%Var: 1:Start coordinate 2:End coordinate 3:angle to shift from acrtext box

\def\arcarrow#1(#3)[#4]{
    \draw[thick,-,>=latex,color=#1,line width=1pt,shorten >=-0pt, shorten <=-0pt]
        let \p1 = (#2), \p2 = (#3), % To access cartesian coordinates x, and y.
            \n1 = {veclen(\x1,\y1)}, % Distance from the origin
            \n2 = {veclen(\x2,\y2)}, % Distance from the origin
            \n3 = {atan2(\y1,\x1)} % Angle where acrtext starts.
        in (\n3-#4: \n1) -- (\n3-#4: \n2); % Draw the arrow.
}
%%%========================================================================
\begin{document}
\maketitle
\section{Chart}
\begin{tikzpicture}[
        % Environment Cfg
        font=\sf    \scriptsize,
        % Styles
        myarrow/.style={
            thick,
            -latex,
        },
        Center/.style ={
            circle,
            fill=white,
            text=root,
            align=center,
            font =\footnotesize,
            inner sep=1pt,

        },
    ]
% Drawing the center
\node[Center](ROOT) at (0,0) {Root \\ Node};

% Drawing the Tex Arcs

% \Arctext[ID][box-style][box-height](radious)(start-angl)(end-angl){|text-styles| Text}
% Node 1:
\arctext[N1][orange1][15pt](1.5)(200)(90){|\footnotesize\bf\color{white}| Node 1};
    %Sub 1:
    \arctext[N1S1][orange1][13pt](2.5)(120)(90){|\footnotesize\bf\color{white}| Sub1};
        \arctext[N1S1S1][orange1][8pt](3.25)(120)(90){|\footnotesize\bf\color{white}| Sub1-Sub1};
    %Sub 2:
    \arctext[N1S2][orange1][13pt](2.5)(160)(120){|\footnotesize\bf\color{white}| Sub2};
        \arctext[N1S2S1][orange1][8pt](4)(170)(140){|\footnotesize\bf\color{white}| Sub2-Sub1};
        \arctext[N1S2S2][orange1][8pt](4)(140)(110){|\footnotesize\bf\color{white}| Sub2-Sub2};
    %Sub 3:
    \arctext[N1S3][orange1][13pt](2.5)(200)(160){|\footnotesize\bf\color{white}| Sub3};

%Node 2:
\arctext[N2][orange2][15pt](1.5)(-90)(90){|\footnotesize\bf\color{white}| Node 2};
    %Sub 1:
    \arctext[N2S1][orange2][13pt](2.5)(90)(50){|\footnotesize\bf\color{white}| Sub 1};
        \arctext[N2S1S1][orange2][8pt](3.25)(90)(60){|\footnotesize\bf\color{white}| Sub3-Sub1};
        %\arcbase[N2S1S2][orange2][8pt](3.9)(80)(50){|\tiny| {\cite{einstein,dirac,knuth-fa,knuthwebsite}}};
    %Sub 2:
    \arctext[N2S2][orange2][13pt](2.5)(50)(20){|\footnotesize\bf\color{white}| Sub 2};
        \arctext[N2S2S1][orange2][6pt](4.5)(40)(15){|\scriptsize\bf\color{white}| Sub3-Sub1};
        \arctext[N2S2S2][orange2][6pt](4.5)(60)(40){|\scriptsize\bf\color{white}| Sub3-Sub2};
    %Sub 3:
    \arctext[N2S3][orange2][13pt](2.5)(-40)(20){|\footnotesize\bf\color{white}| Sub 3};
        \arctext[N2S3S1][orange2][8pt](3.25)(20)(-10){|\footnotesize\bf\color{white}| Sub3-Sub1};
        \arctext[N2S3S2][orange2][8pt](3.25)(-40)(-10){|\footnotesize\bf\color{white}| Sub3-Sub2};
    %Sub 4:
    \arctext[N2S4][orange2][13pt](2.5)(-90)(-40){|\footnotesize\bf\color{white}| Sub 4};

%Node 3:
\arctext[N3][orange3][15pt](1.5)(200)(270){|\footnotesize\bf\color{white}| Node 3};
    \arctext[N3S1][orange3][13pt](2.5)(200)(235){|\footnotesize\bf\color{white}| Sub 1};
    \arctext[N3S2][orange3][13pt](2.5)(235)(270){|\footnotesize\bf\color{white}| Sub 2};
        \arctext[N3S2S1][orange3][8pt](4)(250)(270){|\scriptsize\bf\color{white}| Sub2-Sub1};
        \arctext[N3S2S2][orange3][8pt](4)(230)(250){|\scriptsize\bf\color{white}| Sub2-Sub2};

%Drawing the Arrows
%\arcarrow(above/below ID)(abobe/below ID)[shift]
\arcarrow[orange1](below N1S2S2)(above N1S2)[10];
\arcarrow[orange1](below N1S2S1)(above N1S2)[17];

\arcarrow[orange2](below N2S2S1)(above N2S2)[10];
\arcarrow[orange2](below N2S2S2)(above N2S2)[15];
%\arcarrow[orange2](below N2S1S2)(above N2S2)[25];

\arcarrow[orange3](below N3S2S1)(above N3S2)[-10];
\arcarrow[orange3](below N3S2S2)(above N3S2)[-10];

% new code %
\draw[black] (55:85pt) -- (55:115pt) arc (55:65:115pt)
 node[draw, anchor=south east] {\tiny {\cite{einstein,dirac,knuth-fa,knuthwebsite}}};
% ======== %

\end{tikzpicture}


\begin{thebibliography}{2}
\bibitem{einstein}
\bibitem{dirac}
\bibitem{knuth-fa}
\bibitem{knuthwebsite}
\end{thebibliography}
\clearpage
\bibliographystyle{unsrt}

%\bibliography{bib}  %%% Remove comment to use the external .bib file (using bibtex).
\end{document}
Result: