See, if the following solution works for you:
\documentclass[twocolumn]{article}
\usepackage{booktabs, makecell, multirow}
\renewcommand\theadfont{\normalsize\bfseries}
\renewcommand\theadgape{}
\usepackage{siunitx}
\sisetup{
output-open-uncertainty = (,
output-close-uncertainty = ),
uncertainty-mode=separate
}%
\begin{document}
\begin{table}
\centering
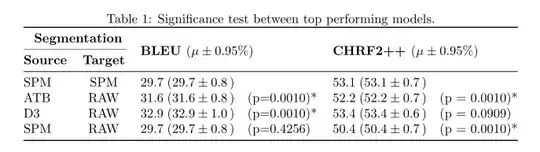
\caption{ Significance test between top performing models.}
\label{table:sign_tok}
\begin{tabular}{@{}lc
{2}{S[table-format=2.1]
@{;(}
S[table-format=2.1(2)]
@{,)\quad }
l} @{}}
\toprule
\multicolumn{2}{c}{\thead{Segmentation}}
& \multicolumn{6}{c}{} \
\cmidrule(r){1-2}
\thead{Source}
& \thead{Target}
& \multicolumn{3}{l}{\multirow{-2.2}{\thead[l]{BLEU $(\mu \pm 0.95 %)$}}}
& \multicolumn{3}{l}{\multirow{-2.2}{\thead[l]{CHRF2++ $(\mu \pm 0.95 %)$}}}
\
\midrule
SPM & SPM & 29.7 & 29.7(8) & & 53.1 & 53.1(7) & \
ATB & RAW & 31.6 & 31.6(8) & (p=0.0010)* & 52.2 & 52.2(7) & (p = 0.0010)* \
D3 & RAW & 32.9 & 32.9(10) & (p=0.0010)* & 53.4 & 53.4(6) & (p = 0.0909) \
SPM & RAW & 29.7 & 29.7(8) & (p=0.4256) & 50.4 & 50.4(7) & (p = 0.0010)* \
\bottomrule
\end{tabular}
\end{table*}
\end{document}
Addendum
To have only three columns (well, I would rather have four):
\documentclass[twocolumn]{article}
\usepackage{booktabs, makecell, multirow}
\renewcommand\theadfont{\normalsize\bfseries}
\renewcommand\theadgape{}
\usepackage{siunitx}
\sisetup{
uncertainty-mode=separate
}%
\begin{document}
\begin{table}
\centering
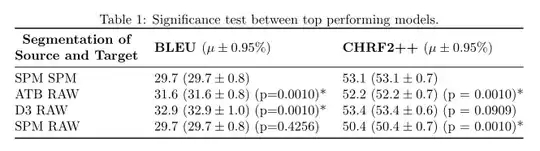
\caption{ Significance test between top performing models.}
\label{table:sign_tok}
\begin{tabular}{@{} lll @{}}
\toprule
\thead{Segmentation of\ Source and Target}
& \thead[l]{BLEU $(\mu \pm 0.95 %)$}
& \thead[l]{CHRF2++ $(\mu \pm 0.95 %)$} \
\midrule
SPM SPM & 29.7 (\num{29.7(8)}) & 53.1 (\num{53.1(7)}) \
ATB RAW & 31.6 (\num{31.6(8)}) (p=0.0010) & 52.2 (\num{52.2(7)}) (p = 0.0010)* \
D3 RAW & 32.9 (\num{32.9(10)}) (p=0.0010)* & 53.4 (\num{53.4(6)}) (p = 0.0909) \
SPM RAW & 29.7 (\num{29.7(8)}) (p=0.4256) & 50.4 (\num{50.4(7)}) (p = 0.0010)* \
\bottomrule
\end{tabular}
\end{table*}
\end{document}
With four columns is much nicer (to my opinion):
\documentclass[twocolumn]{article}
\usepackage{booktabs, makecell, multirow}
\renewcommand\theadfont{\normalsize\bfseries}
\renewcommand\theadgape{}
\usepackage{siunitx}
\sisetup{
uncertainty-mode=separate
}%
\begin{document}
    \begin{table}
    \centering
    \caption{ Significance test between top performing models.}
    \label{table:sign_tok}
\begin{tabular}{@{} ccll @{}}
    \toprule
\multicolumn{2}{c}{\thead{Segmentation}}
        & \multirow{2.2}{}{\thead[l]{BLEU $(\mu \pm 0.95 %)$}}
            & \multirow{2.2}{}{\thead[l]{CHRF2++ $(\mu \pm 0.95 %)$}}   \
    \cmidrule(r){1-2}
\thead{Source}
    & \thead{Target}
        &   &   \
     \midrule
SPM & SPM   & 29.7 (\num{29.7(8)})              & 53.1 (\num{53.1(7)})                \
ATB & RAW   & 31.6 (\num{31.6(8)})  (p=0.0010) & 52.2 (\num{52.2(7)}) (p = 0.0010)*  \
D3  & RAW   & 32.9 (\num{32.9(10)}) (p=0.0010)* & 53.4 (\num{53.4(6)}) (p = 0.0909)   \
SPM & RAW   & 29.7 (\num{29.7(8)})  (p=0.4256)  & 50.4 (\num{50.4(7)}) (p = 0.0010)*  \
    \bottomrule
\end{tabular}
    \end{table*}
\end{document}
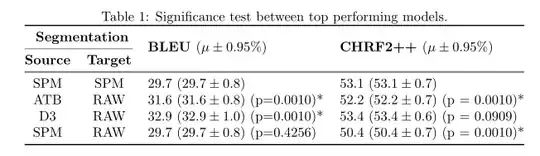


table-formatdefine format of numbers in columns:table-format=<number of integer digits>.<number of decimal digits>. Your table is not very clear. What is difference between third and fourth column). What is data in fifth column? etc. Why this columns haven't own headers? – Zarko Jan 19 '22 at 21:48Target) doesn't need theS-type column specification; usinglwould suffice (like withSource). – Werner Jan 19 '22 at 22:29