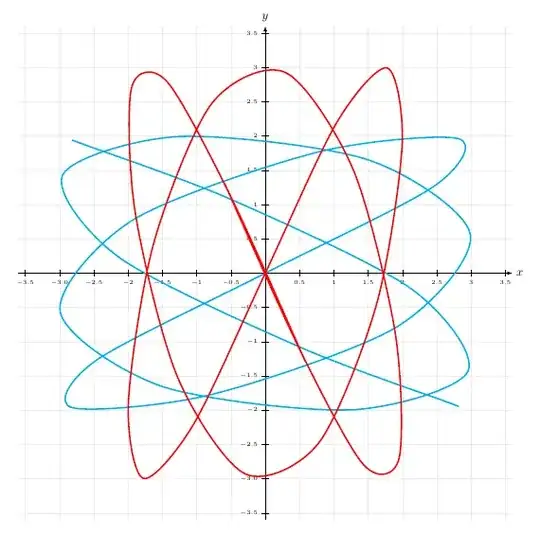
Lissajous functions. Two examples plotted:
\documentclass[border=5mm]{standalone}
\usepackage{tikz}
\begin{document}
    \begin{tikzpicture}[scale=2]
    % axex and grid
    \draw[gray!15] (-3.6,-3.6) grid [step=0.5] (3.6,3.6);
    \draw[-latex] (-3.6,0) -- (3.6,0) node [right] {$x$};
    \draw[-latex] (0,-3.6) -- (0,3.6) node [above] {$y$};
    \foreach \i in {-3.5,-3.0,...,-.5,0.5,1,1.5,...,3.5}
    \draw (\i,0.05) -- (\i,-0.05) node [below] {\tiny $\i$};
    \foreach\i in {-3.5,-3.0,...,-.5,0.5,1,1.5,...,3.5}
    \draw (0.05,\i) -- (-0.05,\i) node [left]  {\tiny $\i$};

    % function1 to draw
    \draw[cyan, very thick] plot[variable=\t,domain=-30*pi:30*pi,smooth] ({3 * sin(7 * \t)}, {2 * sin(5 * \t)});

    % function2 to draw
    \draw[red, very thick] plot[variable=\t,domain=-60*pi:60*pi,smooth] ({2 * sin(2 * \t)}, {3 * sin(3 * \t)});
\end{tikzpicture}


\end{document}
OUTCOME:
ADD:
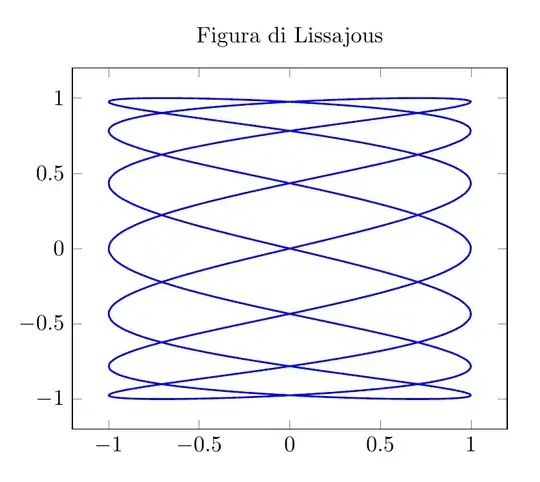
From Lorenzo Pantieri manual, with this code:
\documentclass[border=5mm]{standalone}
\usepackage{pgfplots}
\begin{document}
    \begin{tikzpicture}
        \begin{axis}
            [title={Figura di Lissajous}]
            \addplot
            [domain=0:360,variable=\t,
            samples=200,smooth,thick,blue]
            ({sin(7t)},{sin(2t)});
        \end{axis}
    \end{tikzpicture}
\end{document}
you have the following output: