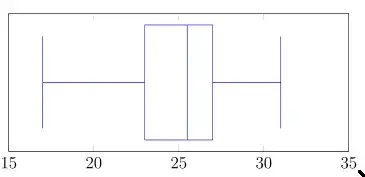
I'm trying to create a box & whiskers plot that includes the upper & lower fence, and the outliers. My current plot looks like this (minus all the labeling):
\documentclass [12pt, letterpaper] {article}
\usepackage {pgfplots}
\pgfplotsset {compat=1.18}
\usepgfplotslibrary {statistics}
\begin {document}
\begin {center}
\begin {tikzpicture}
\begin {axis} [
    xmin = 15,
    xmax = 35,
    xtick = {15, 20, 25, 30, 35},
    ytick = \empty,
    width = 10cm,
    height = 5cm,
]
\addplot + [
    boxplot prepared = {
        median = 25.5,
        upper quartile = 27,
        lower quartile = 23,
        upper whisker = 31,
        lower whisker = 17,
    },
] coordinates {};
\end {axis}
\end {tikzpicture}
\end {center}
\end {document}
The problem is I can't figure out how to add the upper fence, lower fence, and my outliers; I'd need my graph to look more-so like this:


\end {center}? – Dr. Manuel Kuehner Jan 31 '22 at 04:03