2

I would like to plot a directed graph in tikz starting from a transition matrix as the one below. A "1" in position ij indicates state i leads to state j.

[0 0 0 0 0 0 1 0 0 0 0 0 0 0 0 0 0 0 0 0 0 0 0 0 0;
 0 0 0 0 0 0 0 1 0 0 0 0 0 0 0 0 0 0 0 0 0 0 0 0 0;
 0 0 0 0 0 0 1 0 0 0 0 0 0 0 0 0 0 0 0 0 0 0 0 0 0;
 0 0 0 0 0 0 0 0 0 0 0 0 1 0 0 0 0 0 0 0 0 0 0 0 0;
 0 0 0 0 0 0 1 0 0 0 0 0 0 0 0 0 0 0 0 0 0 0 0 0 0;
 0 0 0 0 0 0 1 0 0 0 0 0 0 0 0 0 0 0 0 0 0 0 0 0 0;
 0 0 0 0 0 0 0 0 0 0 0 0 1 0 0 0 0 0 0 0 0 0 0 0 0;
 0 0 0 0 0 0 1 0 0 0 0 0 0 0 0 0 0 0 0 0 0 0 0 0 0;
 0 0 0 0 0 0 0 1 0 0 0 0 0 0 0 0 0 0 0 0 0 0 0 0 0;
 0 0 0 0 0 0 1 0 0 0 0 0 0 0 0 0 0 0 0 0 0 0 0 0 0;
 0 0 0 0 0 0 1 0 0 0 0 0 0 0 0 0 0 0 0 0 0 0 0 0 0;
 0 0 0 0 0 0 1 0 0 0 0 0 0 0 0 0 0 0 0 0 0 0 0 0 0;
 0 0 0 0 0 0 0 0 0 0 0 0 1 0 0 0 0 0 0 0 0 0 0 0 0;
 0 0 0 0 0 0 1 0 0 0 0 0 0 0 0 0 0 0 0 0 0 0 0 0 0;
 0 0 0 0 0 0 1 0 0 0 0 0 0 0 0 0 0 0 0 0 0 0 0 0 0;
 0 0 0 0 0 0 0 0 0 0 0 0 1 0 0 0 0 0 0 0 0 0 0 0 0;
 0 0 0 0 0 0 1 0 0 0 0 0 0 0 0 0 0 0 0 0 0 0 0 0 0;
 0 0 0 0 0 0 0 0 0 0 0 0 1 0 0 0 0 0 0 0 0 0 0 0 0;
 0 0 0 0 0 0 0 1 0 0 0 0 0 0 0 0 0 0 0 0 0 0 0 0 0;
 0 0 0 0 0 0 0 0 0 0 0 0 0 0 0 0 1 0 0 0 0 0 0 0 0;
 0 0 0 0 0 0 0 0 0 0 0 0 1 0 0 0 0 0 0 0 0 0 0 0 0;
 0 0 0 0 0 0 1 0 0 0 0 0 0 0 0 0 0 0 0 0 0 0 0 0 0;
 0 0 0 0 0 0 0 0 0 0 0 0 1 0 0 0 0 0 0 0 0 0 0 0 0;
 0 0 0 0 0 0 1 0 0 0 0 0 0 0 0 0 0 0 0 0 0 0 0 0 0;
 0 0 0 0 0 0 0 0 0 0 0 0 1 0 0 0 0 0 0 0 0 0 0 0 0]

Starting from this (or something similar), I would like to automatically generate a directed graph in tikz. Can you point me in the right direction on how to achieve this?

EDIT: Ideally, I would like the nodes to be located similarly to this https://r-graphics.org/R-Graphics-Cookbook-2e_files/figure-html/FIG-MISCGRAPH-GRAPH-DIRECTED-1.png
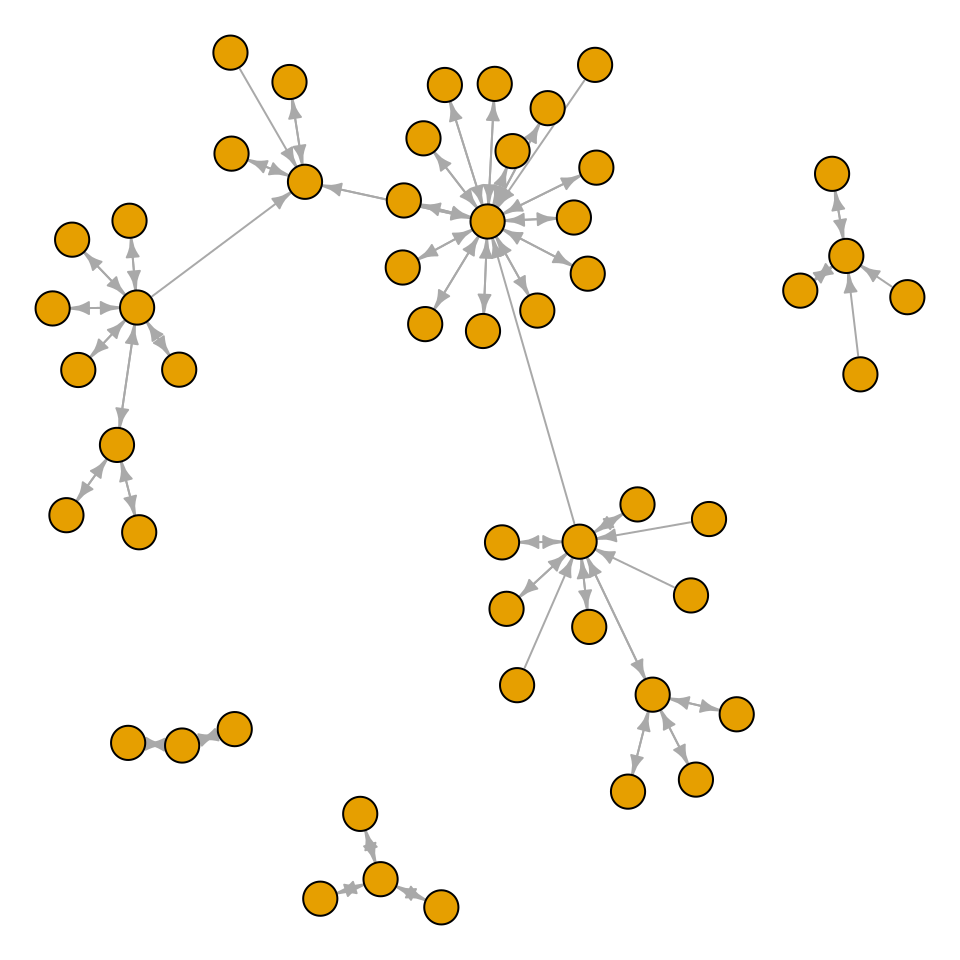
enter image description here

Black Mild
  • 17,569
fennel
  • 97

2 Answers2

3

Perhaps this could be a start point? I don't know where to put the nodes so I'm not sure. Anyway, this is my idea:

\documentclass[tikz,border=2mm]{standalone}
\tikzset{my node/.style={draw,circle,minimum size=0.75cm}}

\begin{document} \begin{tikzpicture} \def\nn{5} % number of nodes \def\r{3} % radius \foreach\i in {1,...,\nn} \node[draw,circle] (\i) at ({360/\nn(\i-1)}:\r) {\i}; \foreach[count=\j]\i in {% Matrix: 1,1,1,0,0, 0,1,0,0,1, 1,1,0,1,1, 0,0,0,1,0, 1,0,0,1,0 } { \ifnum\i=1 \pgfmathtruncatemacro\row{div(\j-1,\nn)+1} \pgfmathtruncatemacro\col{mod(\j-1,\nn)+1} \ifnum\row=\col% same initial and final state \pgfmathtruncatemacro\a{360/\nn(\row-1)+30} \pgfmathtruncatemacro\b{\a-60} \draw[->] (\row.\a) to[out=\a,in=\b,looseness=4] (\row.\b); \else \draw[->] (\row) -- (\col); \fi \fi } \end{tikzpicture} \end{document}

And the output:

enter image description here

SebGlav
  • 19,186
Juan Castaño
  • 28,426
  • Excellent implementation +1. Hope that stays legible with 25 vertices and a lot of edges. – SebGlav Mar 12 '22 at 12:04
  • Thanks @SebGlav (for the edition too). I tried the original example and it didn't look too bad. But there were only a few arrows. In another case I guess it will be worse. – Juan Castaño Mar 12 '22 at 12:11
  • You're right. I just tested it with 13 vertices and it's fine. With 25, some edges overlap vertices. In this case it would be interesting to test the proximity and bend a bit but that could create edges overlapping too... Anyway your solution is already saved for further use ;) – SebGlav Mar 12 '22 at 12:20
  • @JuanCastaño, thank you for your help! I would like to position nodes according to their distance. Would this be something feasible to implement? To give you an idea of what I have in mind see for example: https://r-graphics.org/R-Graphics-Cookbook-2e_files/figure-html/FIG-MISCGRAPH-GRAPH-DIRECTED-1.png – fennel Mar 12 '22 at 12:28
  • @user_231578, but then you need more information than the matrix. I mean, you need also the distances. Or you can draw the vertices first and then apply my code just to join them. – Juan Castaño Mar 12 '22 at 12:34
  • @user_231578, perhaps the picture you linked could be useful in the post. – Juan Castaño Mar 12 '22 at 12:36
  • @JuanCastaño, I will add the picture in the post. Yes, I do need the distances (which I do not know how to compute from the matrix) as well as to map those distances to a set of coordinates. – fennel Mar 12 '22 at 12:38
  • Distances could not be computed from the matrix you provided, which is an adjacency matrix. Then how do the distances affect the vertices placement? I don't think it relates correctly with what topology is. – SebGlav Mar 12 '22 at 15:55
  • @SebGlav I don't think, straight distances can be drawn properly. Imagine three nodes have distances AB=1, BC=2 and AC=4. There's no triangle that would make it possible to have a distance of 4 between AC – unless we include curves and then it gets very messy. – Qrrbrbirlbel Oct 24 '22 at 20:33
0

Code

\documentclass[tikz]{standalone}
\usetikzlibrary{
  arrows.meta,     % for pretty arrows
  graphs,          % for \graph syntax
  graphdrawing}    % for algorithms → LuaLaTeX
\usegdlibrary{force}
\newcommand*\foreachListPlusOneUntil[2]{%
  \ifnum#1<#2 \the\numexpr#1+1\relax,...,#2\fi}
\tikzset{
  weights/matrix/.style={
    /utils/exec=\def\tikzweightrow{0},
    /utils/rows/.style={
      /utils/exec=\def\tikzweightcolumn{0}%
                  \edef\tikzweightrow{\the\numexpr\tikzweightrow+1\relax},
      /utils/cols/.estyle={
        /utils/exec=\edef\noexpand\tikzweightcolumn
          {\noexpand\the\numexpr\noexpand\tikzweightcolumn+1\relax},
        /tikz/weights/weight \tikzweightrow-\noexpand\tikzweightcolumn/.initial
          ={####1}},
      /utils/cols/.list={##1}},
    /utils/rows/.list={#1}}}
\begin{document}
\tikz[
  >=Stealth,
  weights/matrix={
    {0,0,0,0,0,0,1,0,0,0,0,0,0,0,0,0,0,0,0,0,0,0,0,0,0},
    {0,0,0,0,0,0,0,1,0,0,0,0,0,0,0,0,0,0,0,0,0,0,0,0,0},
    {0,0,0,0,0,0,1,0,0,0,0,0,0,0,0,0,0,0,0,0,0,0,0,0,0},
    {0,0,0,0,0,0,0,0,0,0,0,0,1,0,0,0,0,0,0,0,0,0,0,0,0},
    {0,0,0,0,0,0,1,0,0,0,0,0,0,0,0,0,0,0,0,0,0,0,0,0,0},
    {0,0,0,0,0,0,1,0,0,0,0,0,0,0,0,0,0,0,0,0,0,0,0,0,0},
    {0,0,0,0,0,0,0,0,0,0,0,0,1,0,0,0,0,0,0,0,0,0,0,0,0},
    {0,0,0,0,0,0,1,0,0,0,0,0,0,0,0,0,0,0,0,0,0,0,0,0,0},
    {0,0,0,0,0,0,0,1,0,0,0,0,0,0,0,0,0,0,0,0,0,0,0,0,0},
    {0,0,0,0,0,0,1,0,0,0,0,0,0,0,0,0,0,0,0,0,0,0,0,0,0},
    {0,0,0,0,0,0,1,0,0,0,0,0,0,0,0,0,0,0,0,0,0,0,0,0,0},
    {0,0,0,0,0,0,1,0,0,0,0,0,0,0,0,0,0,0,0,0,0,0,0,0,0},
    {0,0,0,0,0,0,0,0,0,0,0,0,1,0,0,0,0,0,0,0,0,0,0,0,0},
    {0,0,0,0,0,0,1,0,0,0,0,0,0,0,0,0,0,0,0,0,0,0,0,0,0},
    {0,0,0,0,0,0,1,0,0,0,0,0,0,0,0,0,0,0,0,0,0,0,0,0,0},
    {0,0,0,0,0,0,0,0,0,0,0,0,1,0,0,0,0,0,0,0,0,0,0,0,0},
    {0,0,0,0,0,0,1,0,0,0,0,0,0,0,0,0,0,0,0,0,0,0,0,0,0},
    {0,0,0,0,0,0,0,0,0,0,0,0,1,0,0,0,0,0,0,0,0,0,0,0,0},
    {0,0,0,0,0,0,0,1,0,0,0,0,0,0,0,0,0,0,0,0,0,0,0,0,0},
    {0,0,0,0,0,0,0,0,0,0,0,0,0,0,0,0,1,0,0,0,0,0,0,0,0},
    {0,0,0,0,0,0,0,0,0,0,0,0,1,0,0,0,0,0,0,0,0,0,0,0,0},
    {0,0,0,0,0,0,1,0,0,0,0,0,0,0,0,0,0,0,0,0,0,0,0,0,0},
    {0,0,0,0,0,0,0,0,0,0,0,0,1,0,0,0,0,0,0,0,0,0,0,0,0},
    {0,0,0,0,0,0,1,0,0,0,0,0,0,0,0,0,0,0,0,0,0,0,0,0,0},
    {0,0,0,0,0,0,0,0,0,0,0,0,1,0,0,0,0,0,0,0,0,0,0,0,0}}]
\graph [
  spring electrical Walshaw 2000 layout,
  node distance=2cm,
  self edge/.style={/tikz/style/.expanded={%
    \ifnum\pgfkeysvalueof{/tikz/weights/weight #1-#1}=1 double\fi}},
  edge 0-1/.style 2 args={parse={#1 <-  #2[self edge=#2]}},
  edge 1-0/.style 2 args={parse={#1  -> #2[self edge=#2]}},
  edge 1-1/.style 2 args={parse={#1 <-> #2[self edge=#2]}},
  nodes={circle, draw, text width=width("00"), align=center},
]{
  \foreach \row in {1,...,\tikzweightrow} {
    \row[self edge=\row],
    \foreach[expand list]\col in {\foreachListPlusOneUntil\row\tikzweightrow}{
      [edge \pgfkeysvalueof{/tikz/weights/weight \row-\col}-%
            \pgfkeysvalueof{/tikz/weights/weight \col-\row}/.try={\row}{\col}]
    }
  }
};
\end{document}

Output

enter image description here

Qrrbrbirlbel
  • 119,821
  • This has the same idea as A662794 but simplified because the weights are either 0 or 1 (false/true). Yes, this defines macros but it makes it very easy to check whether both directions are set (we could also just draw two lines on top of each other) and save us the headache. – Qrrbrbirlbel Oct 24 '22 at 19:06
  • The value electric charge only affects the weight of a node not of an edge. I don't see a way to change the distance of an edge without adding fake nodes between them (and then it's not guaranteed that the edges are straight). – Qrrbrbirlbel Oct 24 '22 at 19:10