This is a proof of concept. It may need tweaking. The basic idea is to use the xstring package to count the number (\strlen) of characters in the text (UTF-8 is ok—see below) and then place and scale each one individually as a node. Horizontal placement is determined (like a Riemann sum) by calculating (xmax-xmin)/strlen. Vertical scaling is determined by the function (also like a Riemann sum).
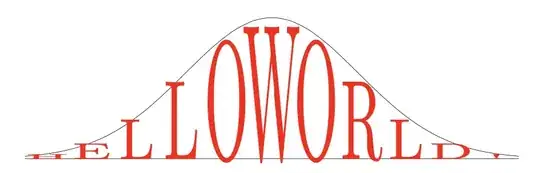
\functext[red]{2*exp(-\x*\x/3)}{-3.5}{3.5}{HELLOWORLD!}
\functext[blue,font=\sffamily\bfseries]{\x*\x/8+1}{-3.5}{3.5}{TEXT UNDER A PARABOLA!}

The general call is
\functext[<tikz options>]{<function>}{<xmin>}{<xmax>}{<text>}
Here is the code:
\documentclass{article}
\usepackage{tikz,xstring}
\newcommand{\xfactor}{25}
\newcommand{\yfactor}{3.9}
\newcommand{\functext}[5][]{\StrLen{#5}[\strlen]\begin{tikzpicture}
    \draw[ultra thin, domain=#3:#4, smooth, variable=\x] plot (\x, {#2});
    \draw[ultra thin] (#3,0)--(#4,0);
    \foreach \n[evaluate=\n as \xt using #3+(#4-#3)/\strlen(\n-.5),
        evaluate=\n as \x using \xt,
        evaluate={\yt=#2}]
        in {1,...,\strlen}{
    \node[inner sep=0pt,anchor=base,yscale=\yt\yfactor,xscale=\xfactor/\strlen,#1] at (\xt,0) {\StrChar{#5}{\n}};
    }
    \end{tikzpicture}}
\begin{document}
\functext[red]{2exp(-\x\x/3)}{-3.5}{3.5}{HELLOWORLD!}
\vspace{1cm}
\functext[blue,font=\sffamily\bfseries]{\x*\x/8+1}{-3.5}{3.5}{TEXT UNDER A PARABOLA!}
\end{document}
The two global constants \xfactor and \yfactor control the width and height of the letters. Larger \xfactor makes the letters wider (overlapping if too large). Larger \yfactor makes the letters taller relative to the function (crossing it if too large). If you want space between the letters and the function, decrease this value. Font changes may require adjustment of these factors.
You can delete the first two \draw commands in the macro if you don't want the curve (and x-axis) drawn.
Lowercase letters are fine but they won't reach the function (except f, d, etc.). UTF-8 characters require \usepackage[T1]{fontenc} in the preamble, and accented uppercase letters will likely extend above the function unless you reduce \yfactor.
The same technique works to draw text between two curves. We define a new macro \funcstext that takes 6 arguments (one optional):
\funcstext[<tikz options>]{<function1>}{<function2>}{<xmin>}{<xmax>}{<text>}
\funcstext[green!50!black,font=\sffamily\bfseries]{2*exp(-\x*\x/3)}{-\x*\x/8}{-3.5}{3.5}{TEXT BETWEEN TWO CURVES!}

Here is the code for the macro:
\newcommand{\funcstext}[6][]{\StrLen{#6}[\strlen]\begin{tikzpicture}
    \draw[ultra thin, domain=#4:#5, smooth, variable=\x] plot (\x, {#2});
    \draw[ultra thin, domain=#4:#5, smooth, variable=\x] plot (\x, {#3});
    \foreach \n[evaluate=\n as \xt using #4+(#5-#4)/\strlen*(\n-.5),
        evaluate=\n as \x using \xt,
        evaluate={\yt=#2-#3},
        evaluate={\yb=#3}]
        in {1,...,\strlen}{
    \node[inner sep=0pt,anchor=base,yscale=\yt*\yfactor,xscale=\xfactor/\strlen,#1] at (\xt,\yb) {\StrChar{#6}{\n}};
    }
    \end{tikzpicture}}
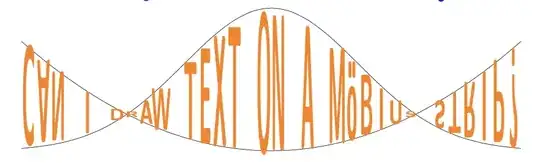
This works even if the functions intersect, with possibly desirable consequences:
\funcstext[orange,font=\sffamily\bfseries]{2*exp(-\x*\x/3)}{\x*\x/8}{-3.5}{3.5}{CAN I DRAW TEXT ON A MöBIUS STRIP?}