Your problem is solved by @David Carlisle comment. In the case, that you like to include code for image from the link in your question, you can do on the following way:
\documentclass[12pt]{article}
%---------------------------------------------------------------%
% part preamble needed for your image
\usepackage{amssymb}
\usepackage{tikz}
%\usepackage{amsfonts}
\definecolor{mycolor}{rgb}{0, 153, 216}
% Style to set camera angle, like PGFPlots view style
\tikzset{viewport/.style 2 args={
x={({cos(-#1)1cm},{sin(-#1)sin(#2)1cm})},
y={({-sin(-#1)1cm},{cos(-#1)sin(#2)1cm})},
z={(0,{cos(#2)*1cm})}
}}
% Convert from spherical to cartesian coordinates
\newcommand{\ToXYZ}[2]{
{sin(#1)cos(#2)}, % X coordinate
{cos(#1)cos(#2)}, % Y coordinate
{sin(#2)} % Z (vertical) coordinate
}
%---------------------------------------------------------------%
% other part preamble needed for your document
\usepackage{lipsum}
\begin{document}
\lipsum[66]
\begin{figure}[ht]
\centering
% code for image
\def\RotationX{-20}
\def\RotationY{30}
\begin{tikzpicture}[scale=4]
\path[ball color= mycolor, draw] (0,0) circle (1);
\begin{scope}[viewport={\RotationX}{\RotationY}]
\draw[variable=\t, smooth, line width=0.2pt]
plot[domain=90-\RotationY:-90-\RotationY, rotate around y=-20] (\ToXYZ{0}{\t})
plot[domain=90-\RotationX:-90-\RotationX, rotate around y=110] (\ToXYZ{\t}{0});
\draw[densely dashed, variable=\t, smooth, line width=0.5pt, opacity=0.3]
plot[domain=90-\RotationY:270-\RotationY, rotate around y=-20] (\ToXYZ{0}{\t})
plot[domain=90-\RotationX:270-\RotationX, rotate around y=110] (\ToXYZ{\t}{0});
\draw[densely dashed, variable=\t, smooth]
plot[domain=-160:-20] (\ToXYZ{15*sin(\t)}{15*cos(\t)});
\fill[color=blue!80!white, opacity=1, variable=\t, smooth]
plot[domain=-21:201] (\ToXYZ{25*sin(\t)}{25*cos(\t)}) --
plot[domain=201:-20] (\ToXYZ{15*sin(\t)}{15*cos(\t)}) -- cycle;
\draw[black, variable=\t, smooth, domain=0:360, line width=0.4pt]
plot[domain=-21:201] (\ToXYZ{25*sin(\t)}{25*cos(\t)})
plot[domain=-21:201] (\ToXYZ{15*sin(\t)}{15*cos(\t)});
\draw[black, variable=\t, smooth, domain=0:360, line width=0.4pt]
plot[domain=55-\RotationY:45-\RotationY, rotate around y=-20] (\ToXYZ{0}{\t})
plot[domain=5-\RotationX:-5-\RotationX, rotate around y=110] (\ToXYZ{\t}{0});
\node[circle, fill, inner sep=1pt] at (\ToXYZ{0}{0}) {};
\node[circle, fill, inner sep=1pt] at (\ToXYZ{15*sin(140)}{15*cos(140)}) {};
\node[] at (1,0.5,0.5) {\Large{$\mathbb S^2$}};
\node[] at (-0.14,0.1,0.6) {\Large{$\gamma$}};
\node[] at (-0.2,0.1,0.4) {\Large{$p$}};
\end{scope}
\end{tikzpicture}
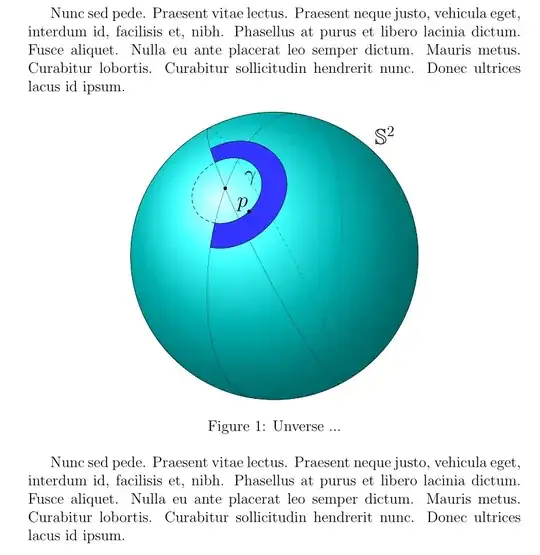
\caption{Unverse ...}
\label{fig:universe}
\end{figure}
\lipsum[66]
\end{document}