According to tikz document P.260:
https://ctan.mirror.globo.tech/graphics/pgf/base/doc/pgfmanual.pdf
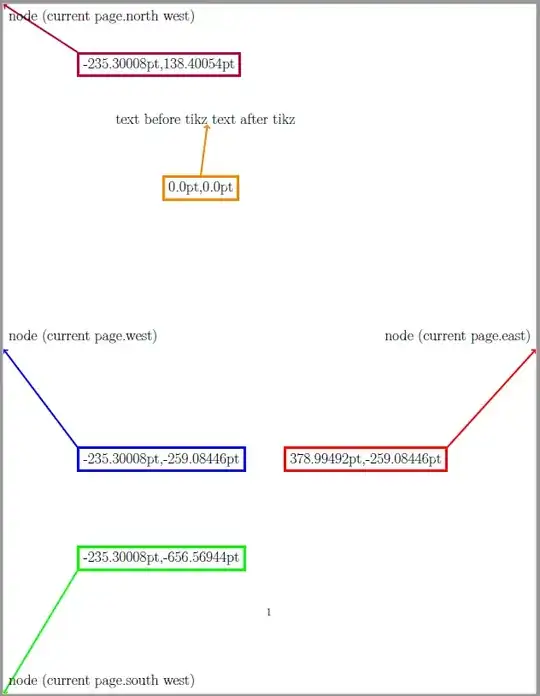
The current page is a predefined node in tikz. This node can be used to access the current page. It is a node of shape rectangle whose south west anchor is the lower left corner of the page and whose north east anchor is the upper right corner of the page. You can reference it as if it were defined in some remembered picture other than the current one. Thus, by giving the remember picture and the overlay options to a picture, you can position nodes absolutely on a page.
To illustrate this, I used the following code to pointing out some locations of the current page. I extract the coordinates of these locations using the command \pgfgetlastxy{\marcox}{\marcoy}. And type out the coordinates use \marcox and \marcoy. The extracted coordinate results depend on where you insert your tikzpicture environment. In this example, the tikzpicture environment is inserted right after the text: "text before tikz". So tikz will treat the bottom left corner of typing box after the letter z as the origin. The extracted coordinate at this origin location will be (0pt,0pt). And the rest of extracted coordinates will according to this origin location. If the node is located at the left side of the origin, the x coordinate will be negative. If the node is located below the origin, the y coordinate will be negative.
\documentclass[12pt]{article}
\usepackage{tikz}
\begin{document}
\Large
text before tikz\begin{tikzpicture}[remember picture,overlay,shift=(current page.south west)]
\draw [line width=2pt,purple,->] (3,26) -- (current page.north west);\pgfgetlastxy{\NWx}{\NWy}
\node at (current page.north west) [anchor=north west] {node (current page.north west)};
\node at (3,26) [line width=2pt,shape=rectangle,draw=purple,anchor=north west] {\NWx,\NWy};
\draw [line width=2pt,red,->] (18,10) -- (current page.east);\pgfgetlastxy{\eastx}{\easty}
\node at (current page.east) [anchor=south east] {node (current page.east)};
\node at (18,10) [line width=2pt,shape=rectangle,draw=red,anchor=north east] {\eastx,\easty};
\draw [line width=2pt,blue,->] (3,10) -- (current page.west);\pgfgetlastxy{\westx}{\westy}
\node at (current page.west) [anchor=south west] {node (current page.west)};
\node at (3,10) [line width=2pt,shape=rectangle,draw=blue,anchor=north west] {\westx,\westy};
\draw [line width=2pt,green,->] (3,5) -- (current page.south west);\pgfgetlastxy{\SWx}{\SWy}
\node at (current page.south west) [anchor=south west] {node (current page.south west)};
\node at (3,5) [line width=2pt,shape=rectangle,draw=green,anchor=south west] {\SWx,\SWy};
\draw [line width=2pt,orange,<-] (235.30008pt,656.56944pt) -- (8,21);\pgfgetlastxy{\originx}{\originy}
\node at (8,21) [line width=2pt,shape=rectangle,draw=orange,anchor=north] {\originx,\originy};
\end{tikzpicture} text after tikz
\end{document}
The output PDF illustrate the results better than what I write here.

\paperwidthand\paperheight. – Sigur Apr 27 '22 at 02:21