In the particular case you can make the objects in the first row larger by using phantoms.
\documentclass{article}
\usepackage{amsmath}
\usepackage[all,cmtip]{xy}
\usepackage{bm}
\begin{document}
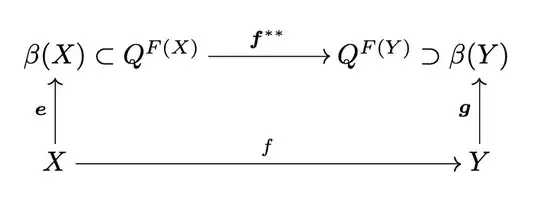
[
\xymatrix@C+2em{
\hphantom{Q^{F(X)}\subset{}}\beta(X)\subset Q^{F(X)}
\ar[r]^{\bm{f}^{**}} &
Q^{F(Y)}\supset\beta(Y)\hphantom{{}\subset Q^{F(Y)}}\
X\ar[u]^{\bm{e}} \ar[r]^{f} & Y\ar[u]^{\bm{g}} \
}
]
\end{document}
- Never use
$$ in LaTeX
- Avoid superfluous columns, it's better to increase the column separation
- Use
cmtip or the arrow tips are awful
- Is there a reason why just one label is not
\bm?
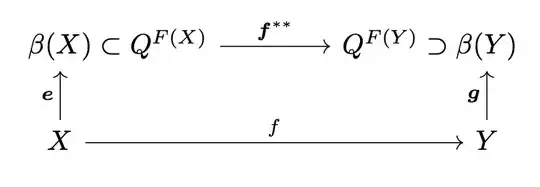
The same with tikz-cd and the nice code from https://tex.stackexchange.com/a/216042/4427
\documentclass{article}
\usepackage{amsmath}
\usepackage{tikz-cd}
\usepackage{bm}
\tikzset{
  symbol/.style={
    draw=none,
    every to/.append style={
      edge node={node [sloped, allow upside down, auto=false]{$#1$}}}
  }
}
\begin{document}
[
\begin{tikzcd}[column sep=4em]
  \beta(X) \arrow[r,symbol=\subset] &[-3.5em]
  Q^{F(X)} \arrow[r,"\bm{f}^{**}"] &
  Q^{F(Y)} \arrow[r,symbol=\supset] &[-3.5em]
  \beta(Y)
  \
  X \arrow[u,"\bm{e}"] \arrow[rrr,"f"] &&& Y\arrow[u,"\bm{g}"]
\end{tikzcd}
]
\end{document}
 But I have trouble with the position of the arrows.


xy? – Miyase Jun 20 '22 at 11:39