First, a note on this:
\pgfmathsetmacro{\b}{0.7};
\pgfmathsetmacro{\p}{0.4};
\pgfmathsetmacro{\A}{1};
There should be no ; here because these are not TikZ nor pgfplots statements like \path, \draw, \addplot, etc. These semicolons are the cause of the following error message (3 times) in the terminal output of TeX:
Missing character: There is no ; in font nullfont!
Also, while using \pgfmathsetmacro is correct, it is heavy machinery for simple constants written directly in decimal form. I propose to use \def for these, which will be equivalent but faster.
(Beware of single-letter control sequences though... macros like \c or \i have a standard definition in LaTeX; in certain circumstances, you could experience problems when overridding them. That said, local def. + mostly-computation-code like here is probably “not too unsafe”.).
pgfmath's declare function key
The tool you are looking for is /pgf/declare function (see Customizing the Mathematical Engine in the TikZ & PGF manual).
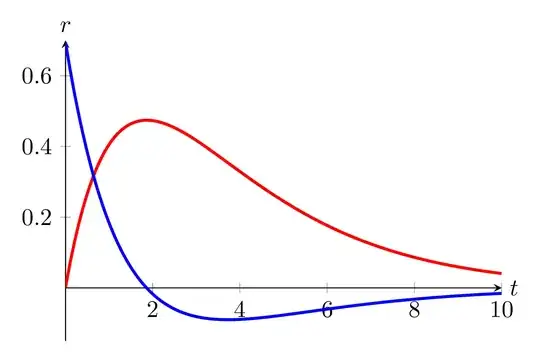
Using this tool and a dx step of 0.1, your idea gives:
\documentclass[tikz,border=2mm]{standalone}
\usepackage{pgfplots}
\pgfplotsset{compat=1.18}
\begin{document}
\begin{tikzpicture}[
  declare function = {
    f(\x) = \A * \b * ((exp(-\b(\x))/(\p-\b)) + (exp(-\p(\x))/(\b-\p)));},
  ]
  \def\b{0.7}
  \def\p{0.4}
  \def\A{1}
  \begin{axis}[
    width=8cm, height=6cm, ymin=-0.15, ymax=0.7,
    axis lines=middle,
    x label style={at={(axis cs:10,0)}, anchor=west},
    y label style={at={(0,1)}, above},
    xlabel={$t$}, ylabel={$r$},
    ]
    \addplot[red, very thick, samples=100, smooth, domain=0.003:10]
      { f(x) };
    \addplot[blue, very thick, samples=100, smooth, domain=0.003:10]
      { (f(x + 0.1) - f(x)) / 0.1 };
  \end{axis}
\end{tikzpicture}
\end{document}
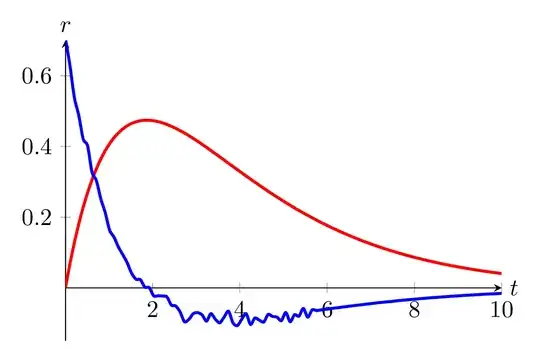
If one uses the 0.01 step as in your question, the low accuracy of computations gives less pleasant results:
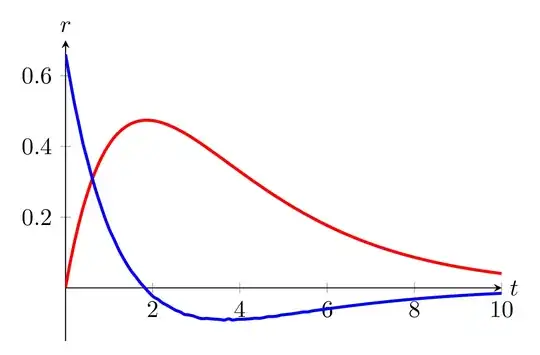
Using \fpeval for better numerical accuracy
One can obtain good results with the 0.01 step using \fpeval (not from pgfmath, and in particular doesn't use the fpu library). This technique is slower and it is more cumbersome to give a usable expression of the “derivative” this way, but the result looks good:
\documentclass[tikz,border=2mm]{standalone}
\usepackage{xfp}   % not needed if the LaTeX kernel is from 2022-06-01 or later
\usepackage{pgfplots}
\pgfplotsset{compat=1.18}
\pgfmathdeclarefunction{g}{1}{%
  \begingroup
  \pgfmathfloattofixed{#1}%
  \let\x\pgfmathresult
  \edef\pgfmathresult{%
    \fpeval{
      (\A * \b * ((exp(-\b(\x + 0.01))/(\p-\b)) + (exp(-\p(\x + 0.01))/(\b-\p)))
      - (\A * \b * ((exp(-\b(\x))/(\p-\b)) + (exp(-\p(\x))/(\b-\p)))))
      / 0.01}%
  }%
  \pgfmathsmuggle\pgfmathresult
  \endgroup
}
\begin{document}
\begin{tikzpicture}[
  declare function = {
    f(\x) = \A * \b * ((exp(-\b(\x))/(\p-\b)) + (exp(-\p(\x))/(\b-\p)));},
  ]
  \def\b{0.7}
  \def\p{0.4}
  \def\A{1}
  \begin{axis}[
    width=8cm, height=6cm, ymin=-0.15, ymax=0.7,
    axis lines=middle,
    x label style={at={(axis cs:10,0)}, anchor=west},
    y label style={at={(0,1)}, above},
    xlabel={$t$}, ylabel={$r$},
    ]
    \addplot[red, very thick, samples=100, smooth, domain=0.003:10]
      { f(x) };
    \addplot[blue, very thick, samples=100, smooth, domain=0.003:10]
      { g(x) };
  \end{axis}
\end{tikzpicture}
\end{document}