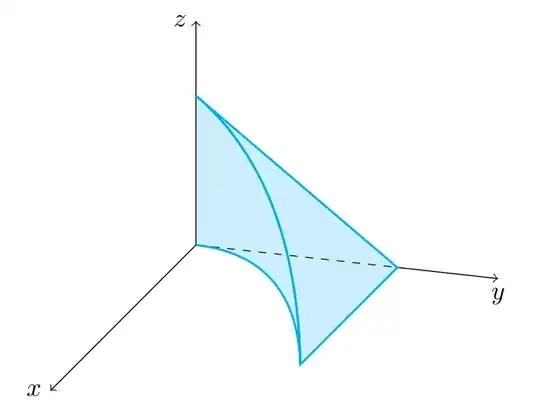
This should give you a good starting point. To plot the square root, I chose to plot x² against x instead of x against sqrt(x), because the precision of the square root calculation in TeX is not very good and also takes a long time.
\documentclass{article}
\usepackage{tikz}
\begin{document}
\begin{tikzpicture}[x={(-1.3cm,-1.3cm)},y={(2.7cm,-.3cm)},z={(0cm,2cm)}]
  \draw[->] (0,0,0) -- (1.5,0,0) node[left] {$x$};
  \draw[dashed] (0,0,0) -- (0,1,0);
  \draw[->] (0,1,0) -- (0,1.5,0) node[below] {$y$};
  \draw[->] (0,0,0) -- (0,0,1.5) node[left] {$z$};
  \draw[thick,cyan] (0,0,0)
    -- plot[domain=0:1] ({\x*\x},{\x},{0})
    -- plot[domain=1:0] ({\x*\x},{\x},{1-\x});
  \fill[cyan,opacity=.2] (0,0,0)
    -- plot[domain=0:1] ({\x*\x},{\x},{0})
    -- plot[domain=1:0] ({\x*\x},{\x},{1-\x});
    -- cycle;
  \draw[thick,cyan] (0,0,1)
    -- plot[domain=0:1] ({\x*\x},{\x},{1-\x})
    -- (0,1,0)
    -- cycle;
  \fill[cyan,opacity=.2] (0,0,1)
    -- plot[domain=0:1] ({\x*\x},{\x},{1-\x})
    -- (0,1,0)
    -- cycle;
\end{tikzpicture}
\end{document}